
30 Day Map Challenge 2023
I participated in the #30DayMapChallenge in 2023. Many of the maps are interactive! If you can click on the image it will redirect you to the interactive version. Note that if the map was made with PyScript, the page could take ~30 seconds to load.
Day 1: Points
Populated places that have “cat” in the name.
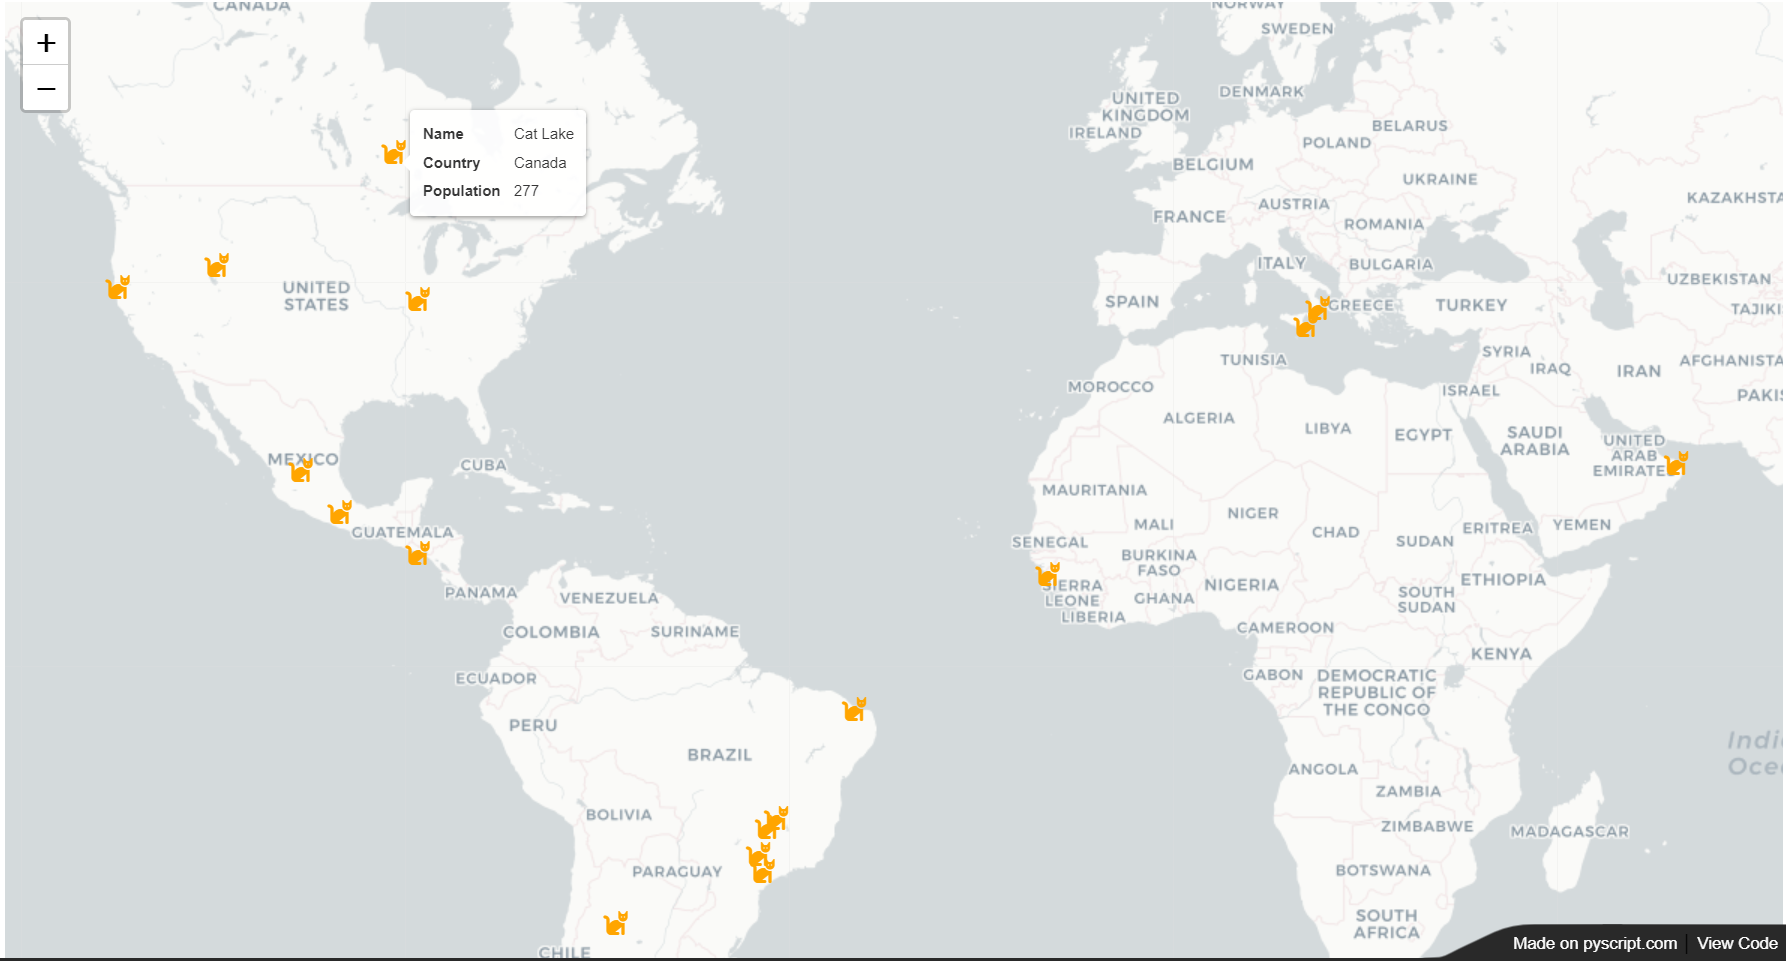
Data sources: Natural Earth
Tools: Python, geopandas, PyScript
Day 2: Lines
My running and kayaking GPS tracks at Lake Union.
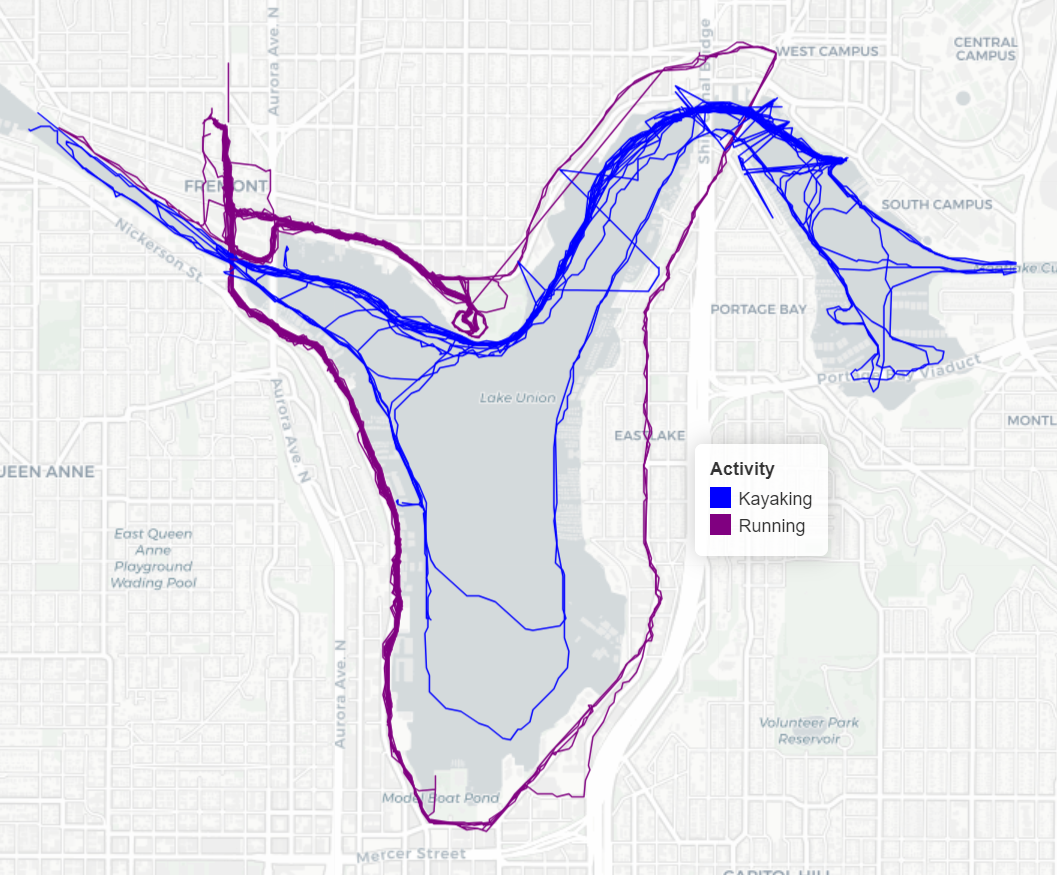
Data sources: Strava
Tools: Python, geopandas, PyScript
Day 3: Polygons
A country guesser game! Every time you refresh the page, a new mystery country will be shown. Take a (mental) guess and then hover over the area to see if you were right.
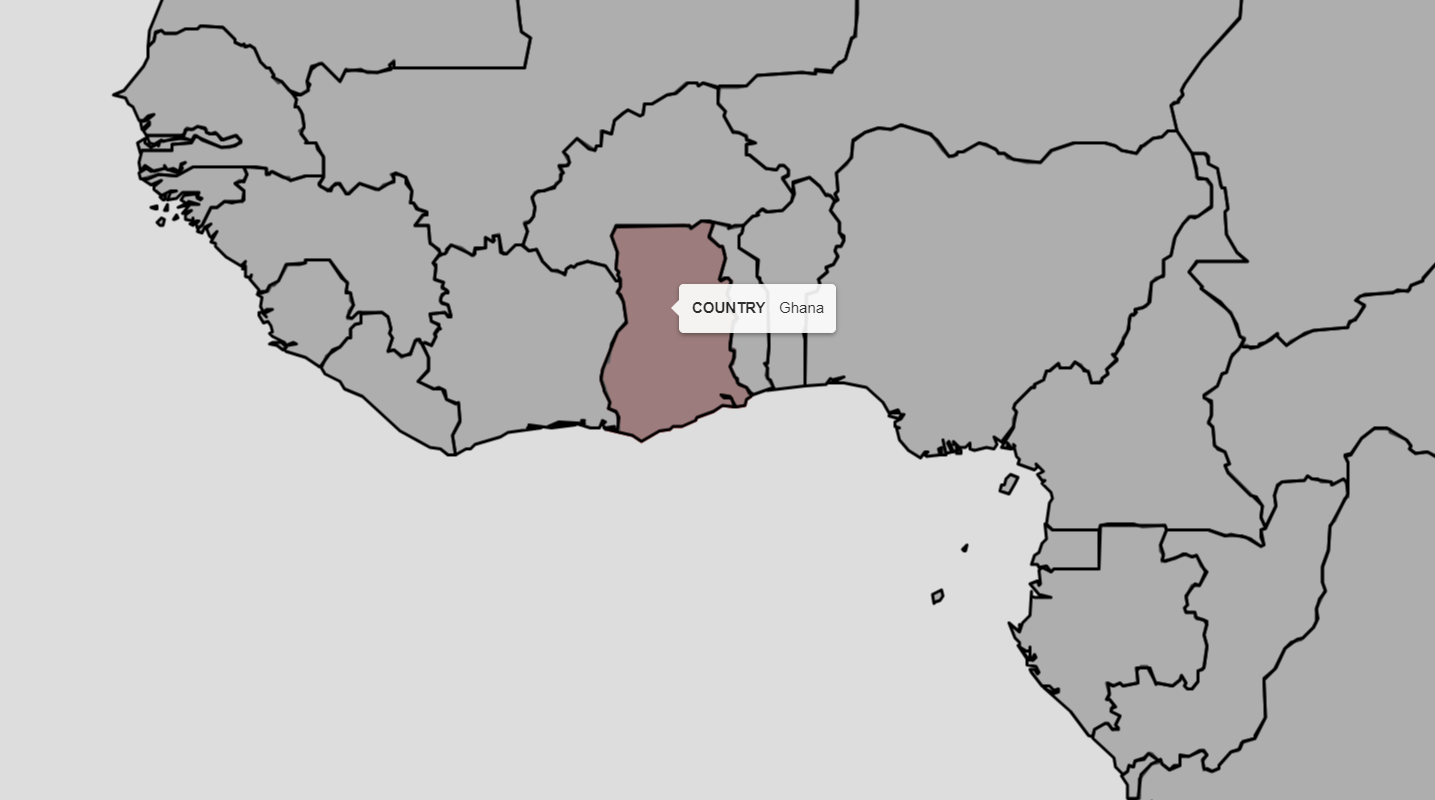
Data sources: Esri
Tools: Python, geopandas, PyScript
Day 4: A Bad Map
Seattle neighborhoods colored by name alphabetically. It may look cool but good luck figuring out which neighborhood is which!
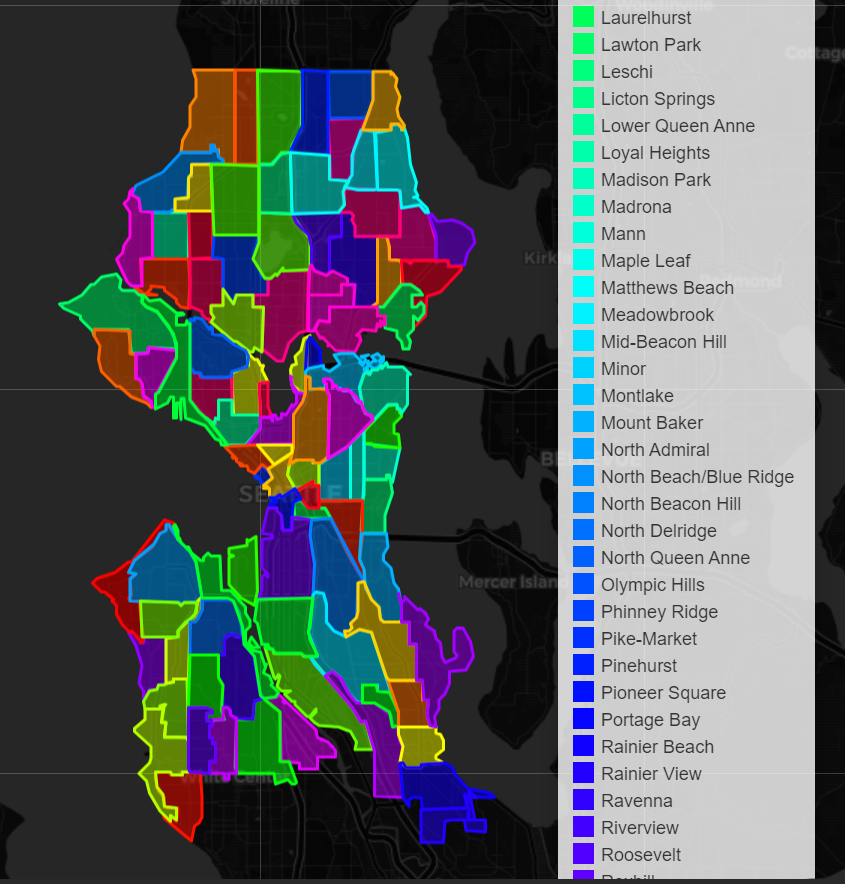
Data sources: City of Seattle
Tools: Python, geopandas, PyScript
Day 5: Analog Map
“Neighborhoods CATS” Analog is so unforgiving!
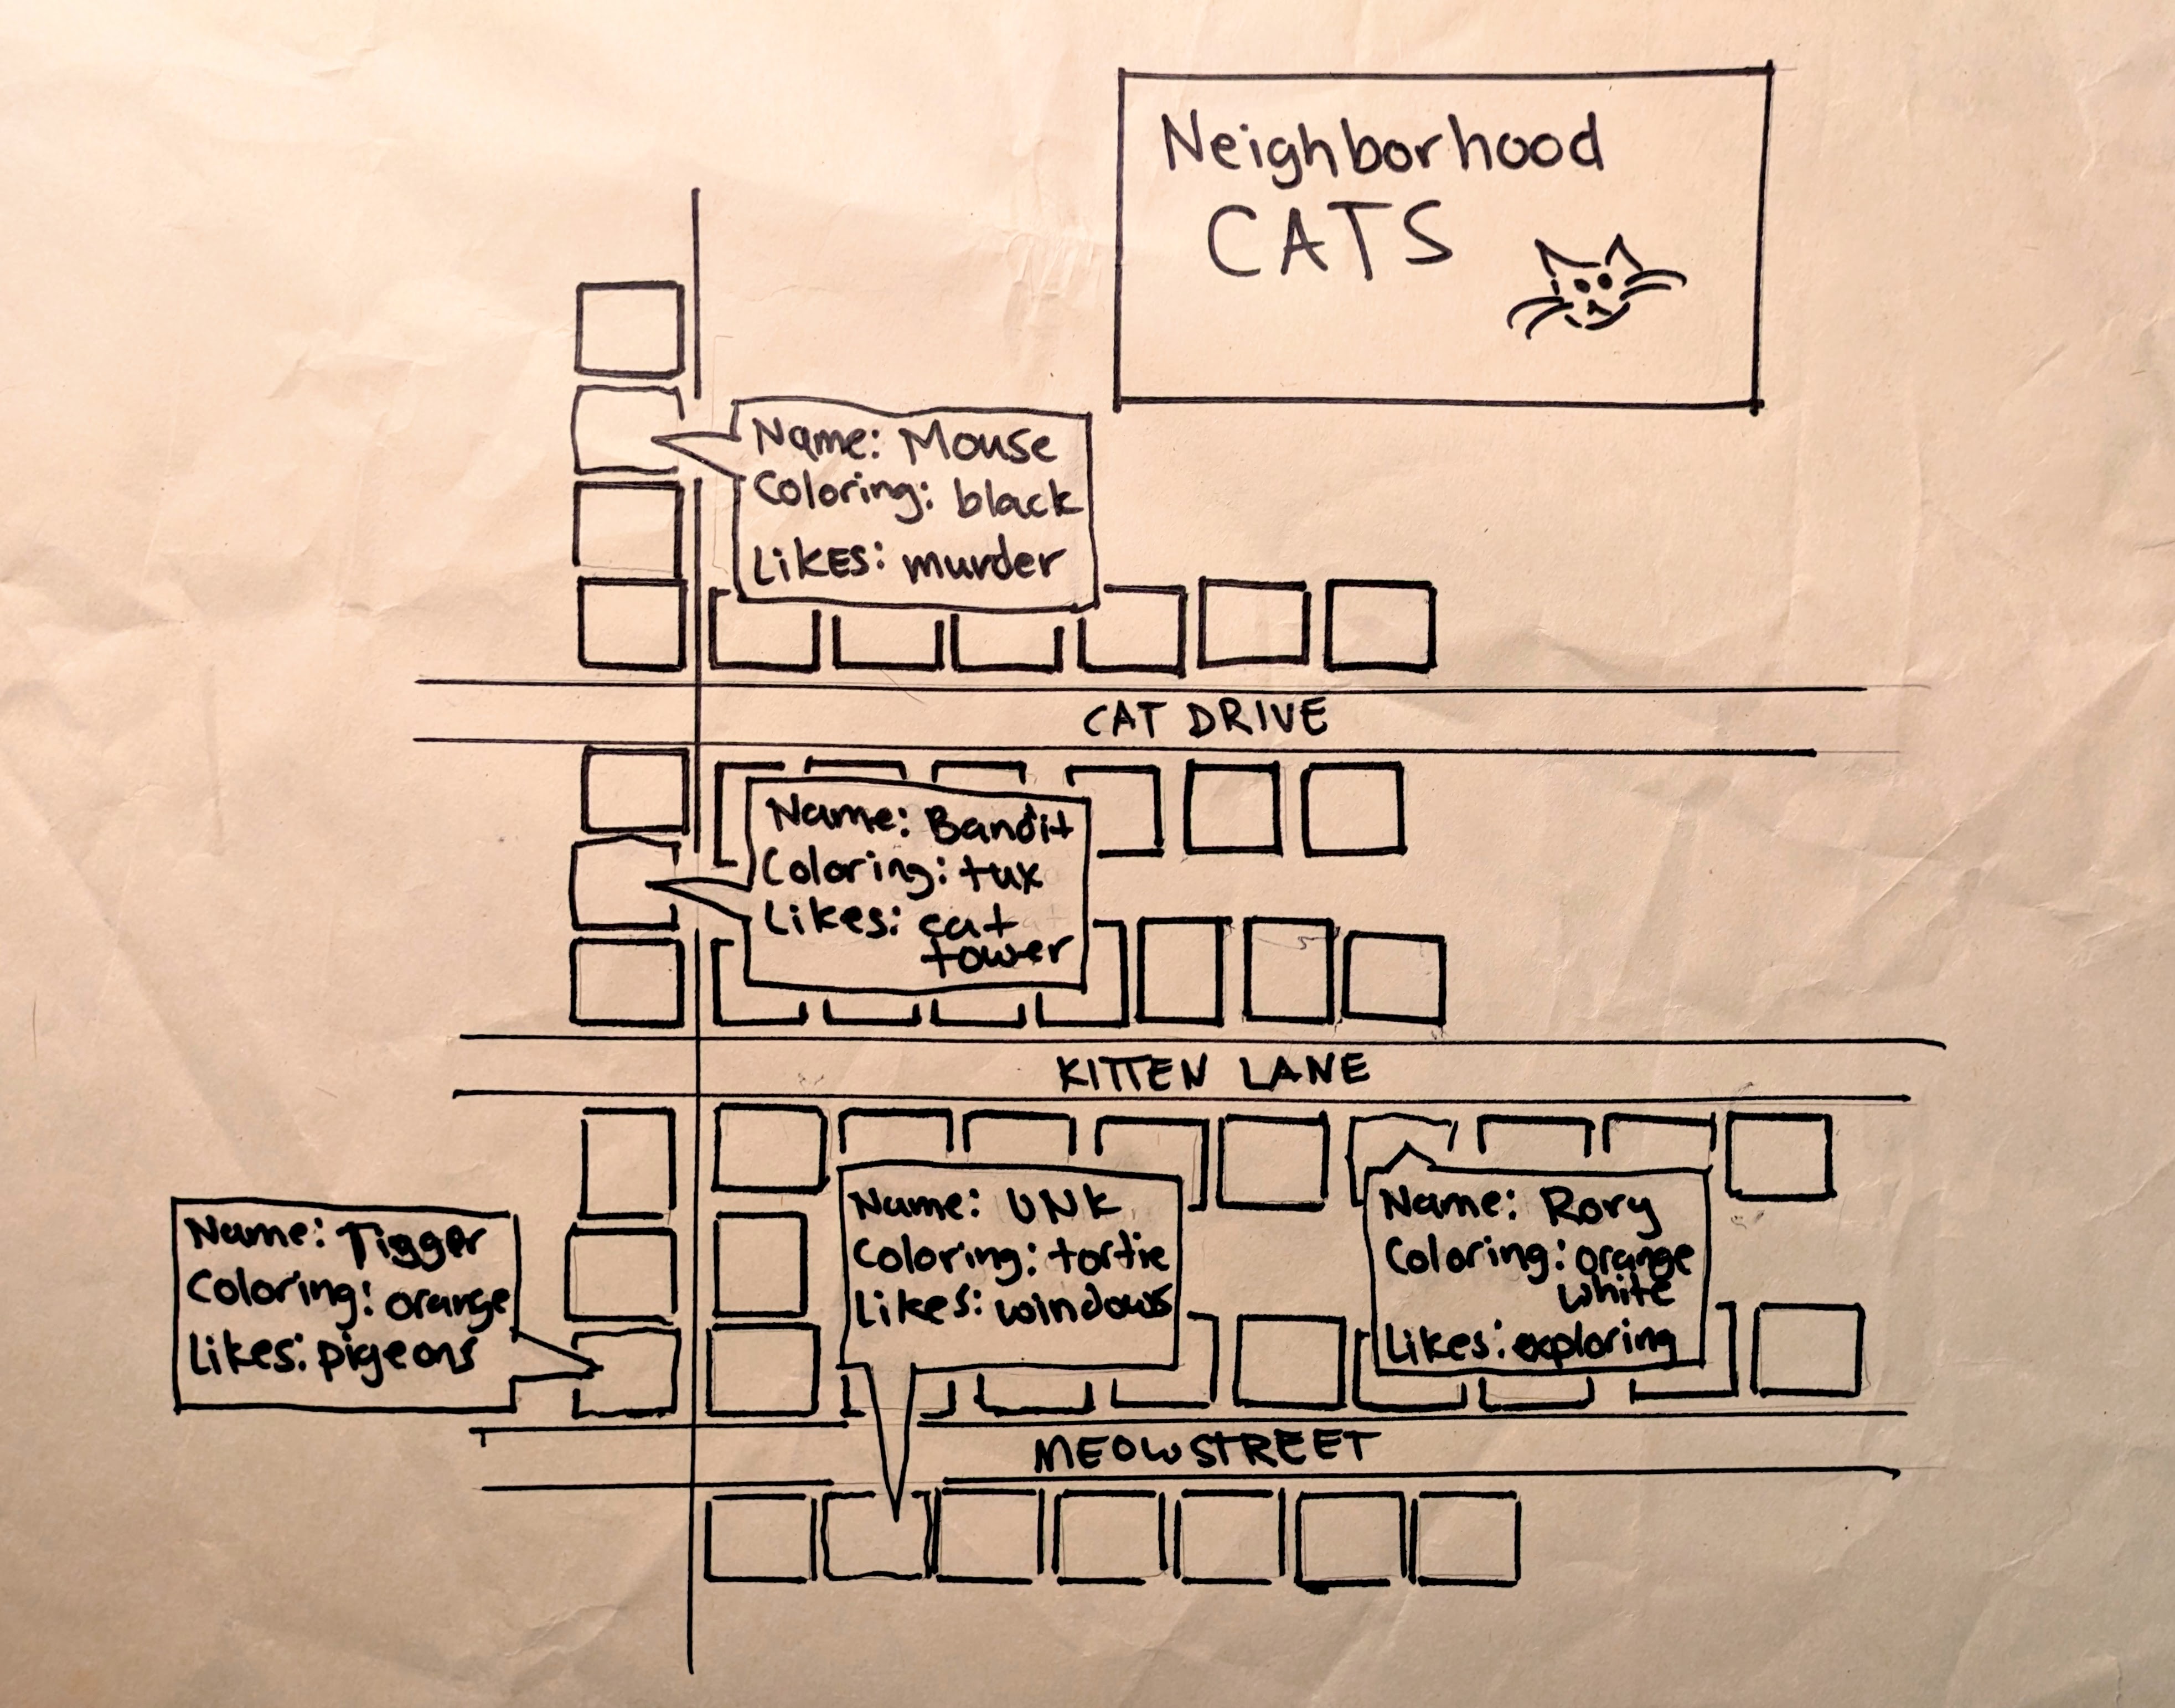

Media: packing paper, Sharpie
Day 6: Asia
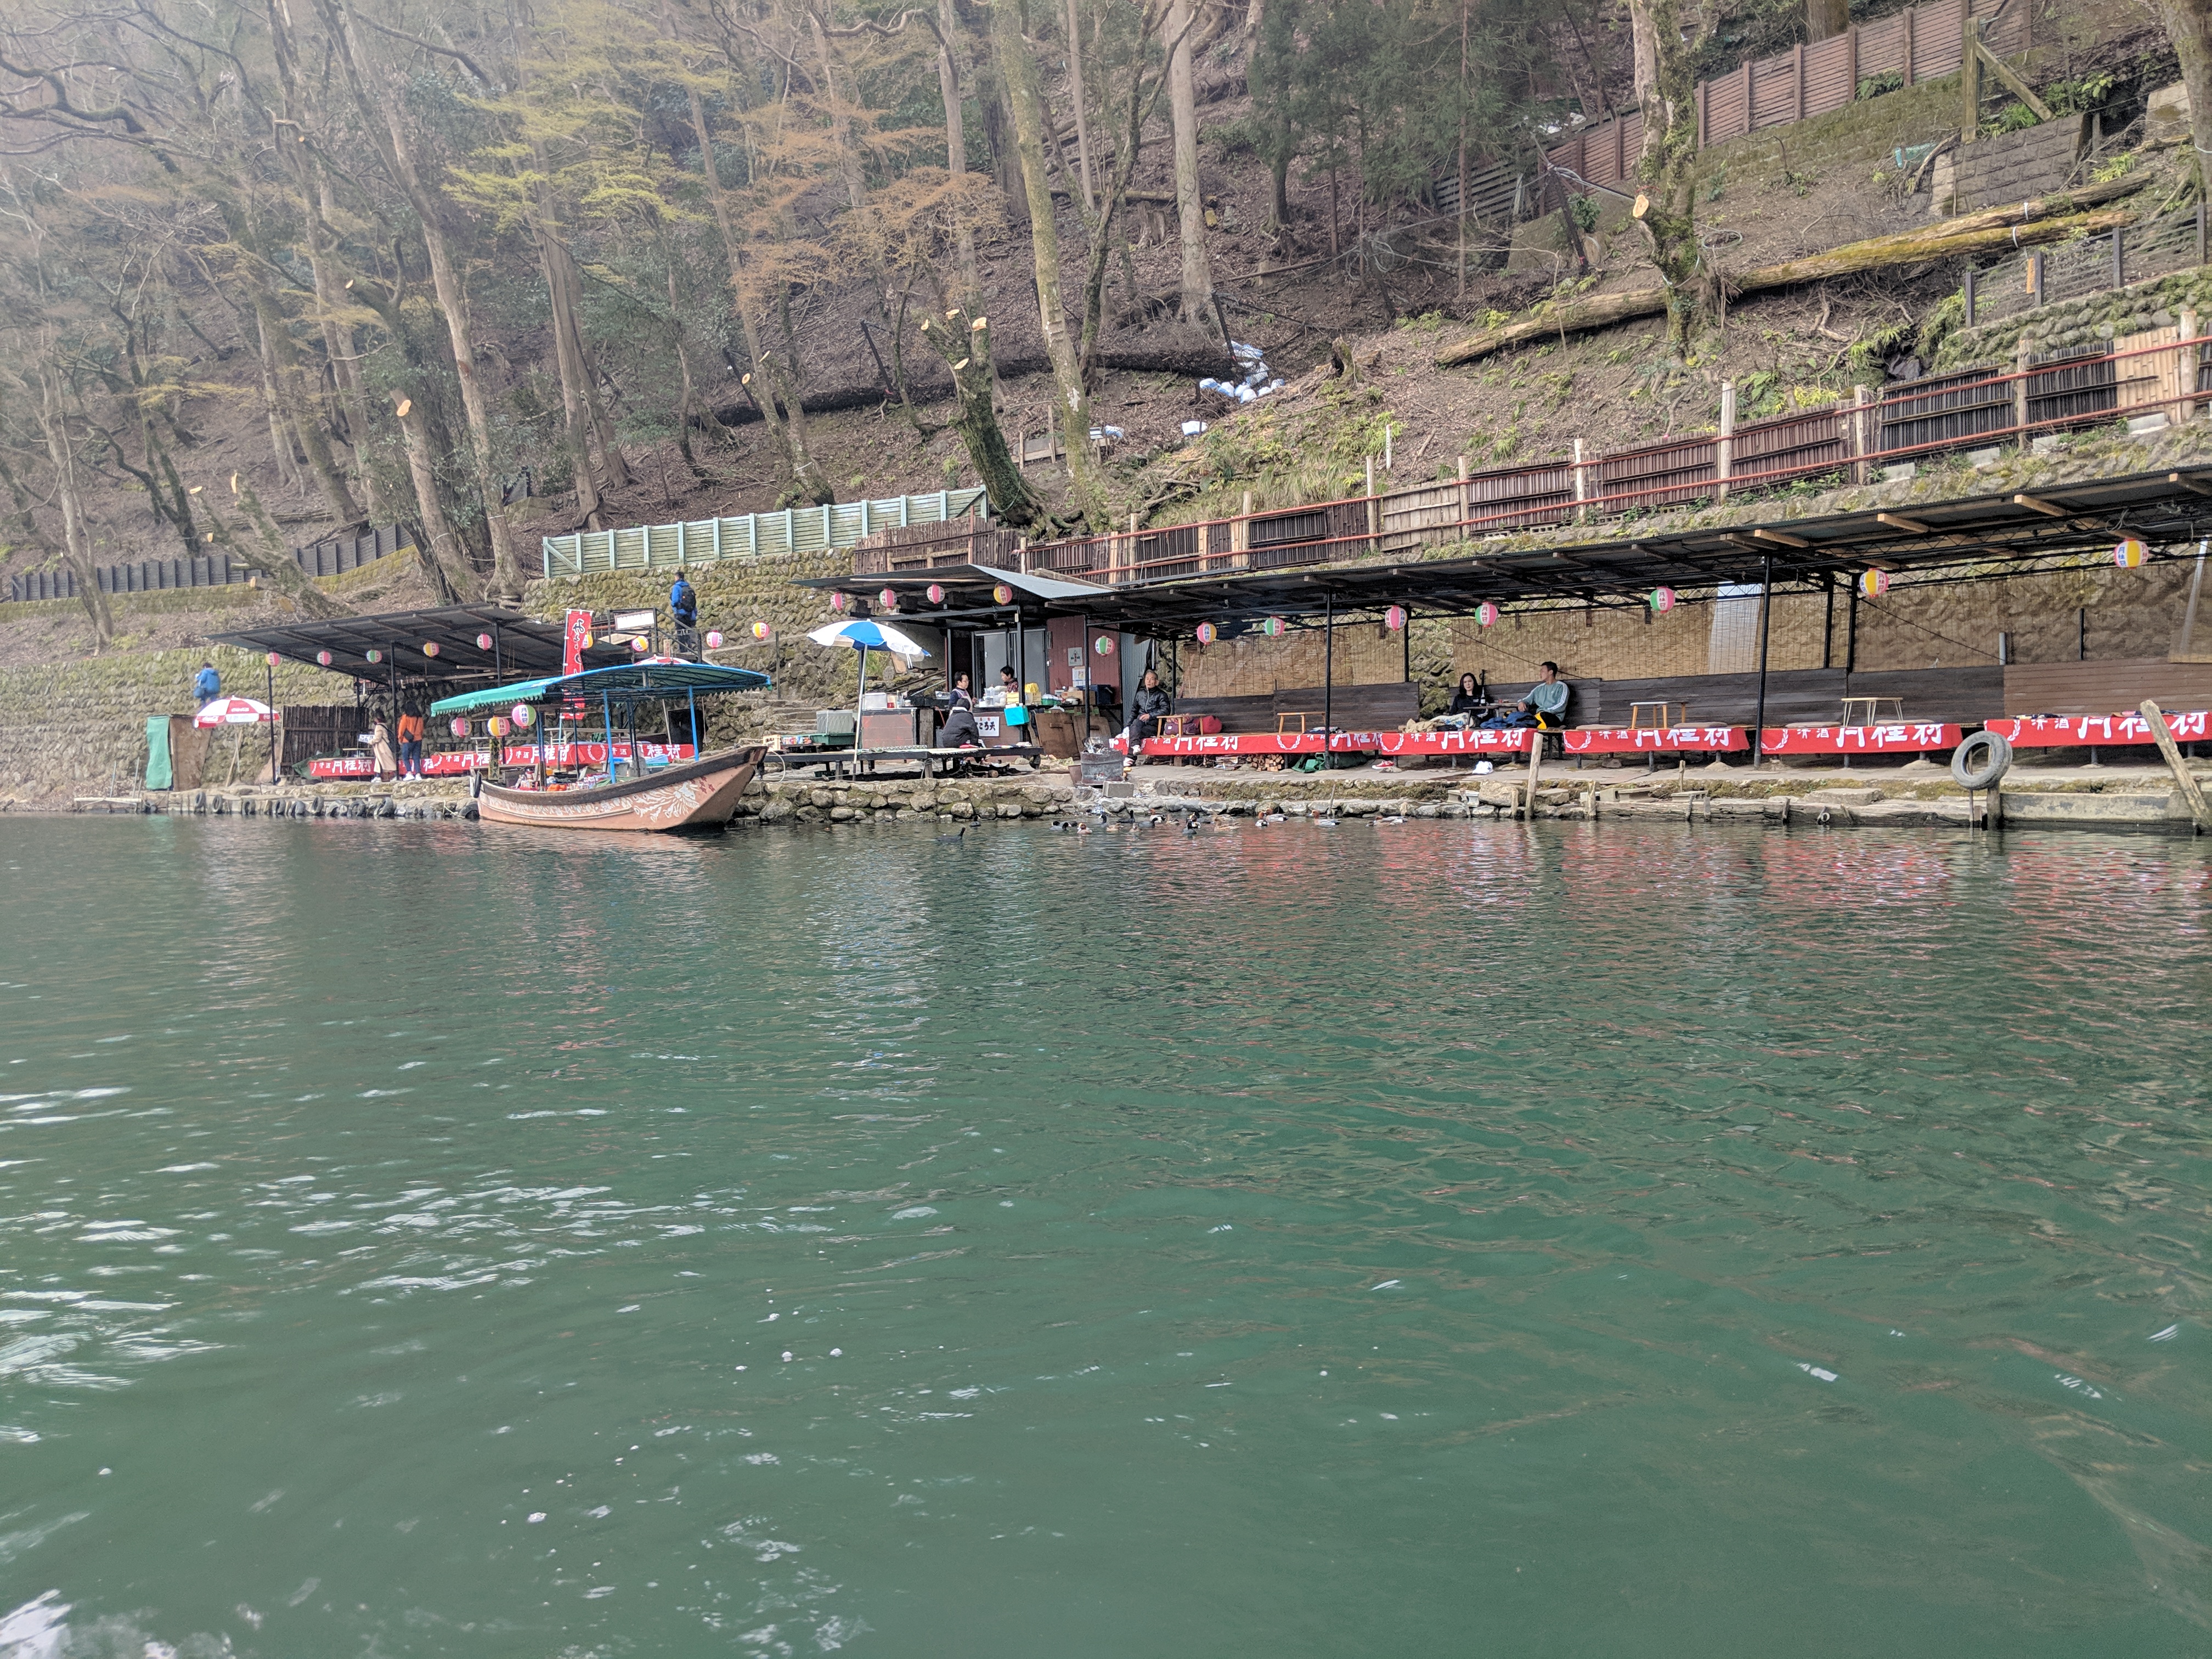
Boat rentals in Japan. Reminds me of when I rented a canoe near Arashiyama in Kyoto, though that rental place is not in the dataset.
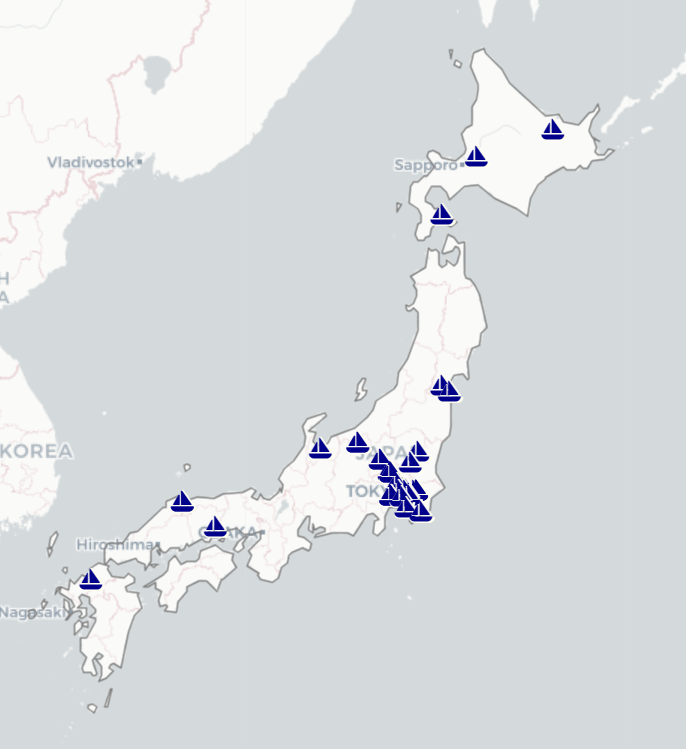
Data Source: OpenStreetMap via overpass-turbo
Tools: Python, geopandas, PyScript
Day 7: Navigation
There’s a beautiful spot on Bainbridge Island that you can get to from Seattle with out a car… if you’re creative.


Tools: Python, geopandas, PyScript
Day 8: Africa
Estimated rainfall (in mm) in central Africa on November 6, 2023 using the RFE 2.0 model.
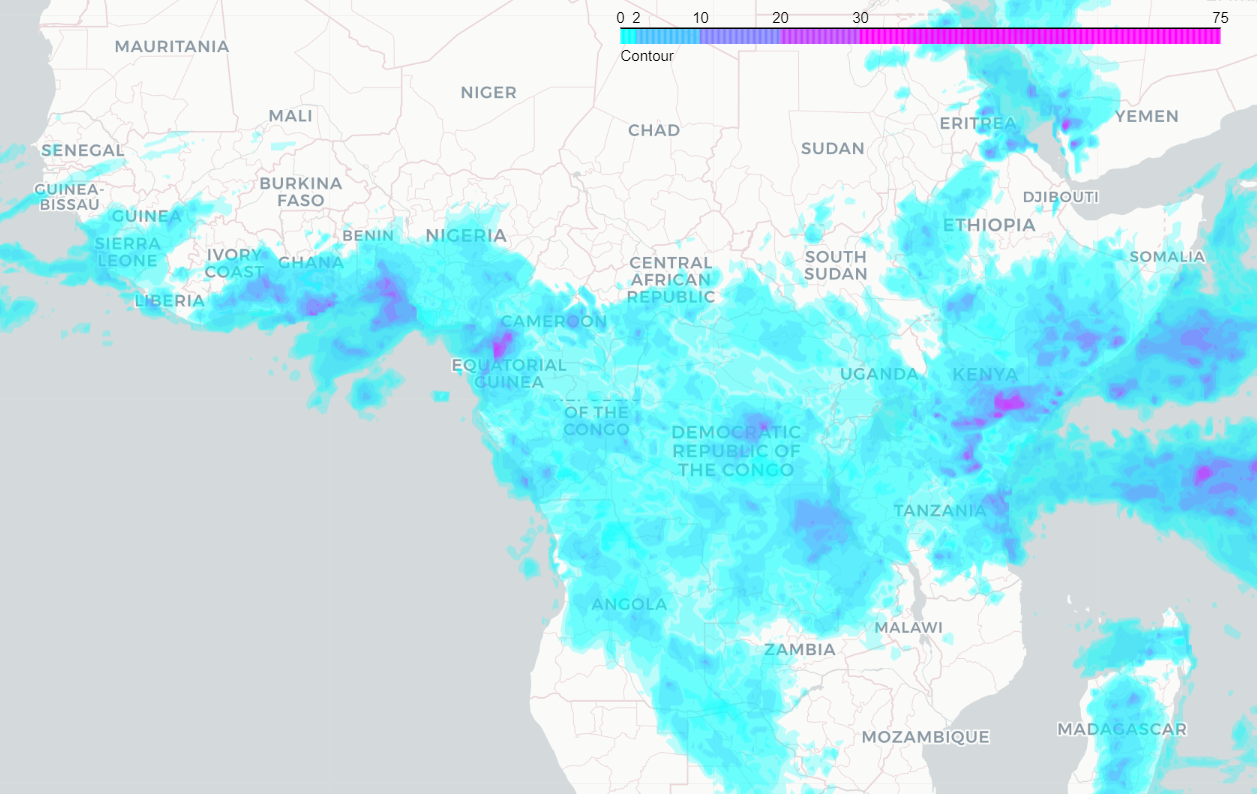
Data source: NOAA
Tools: Python, geopandas
Day 9: Hexagons
Number of American Crow sightings in Connecticut between 2021-today (November, 2023).
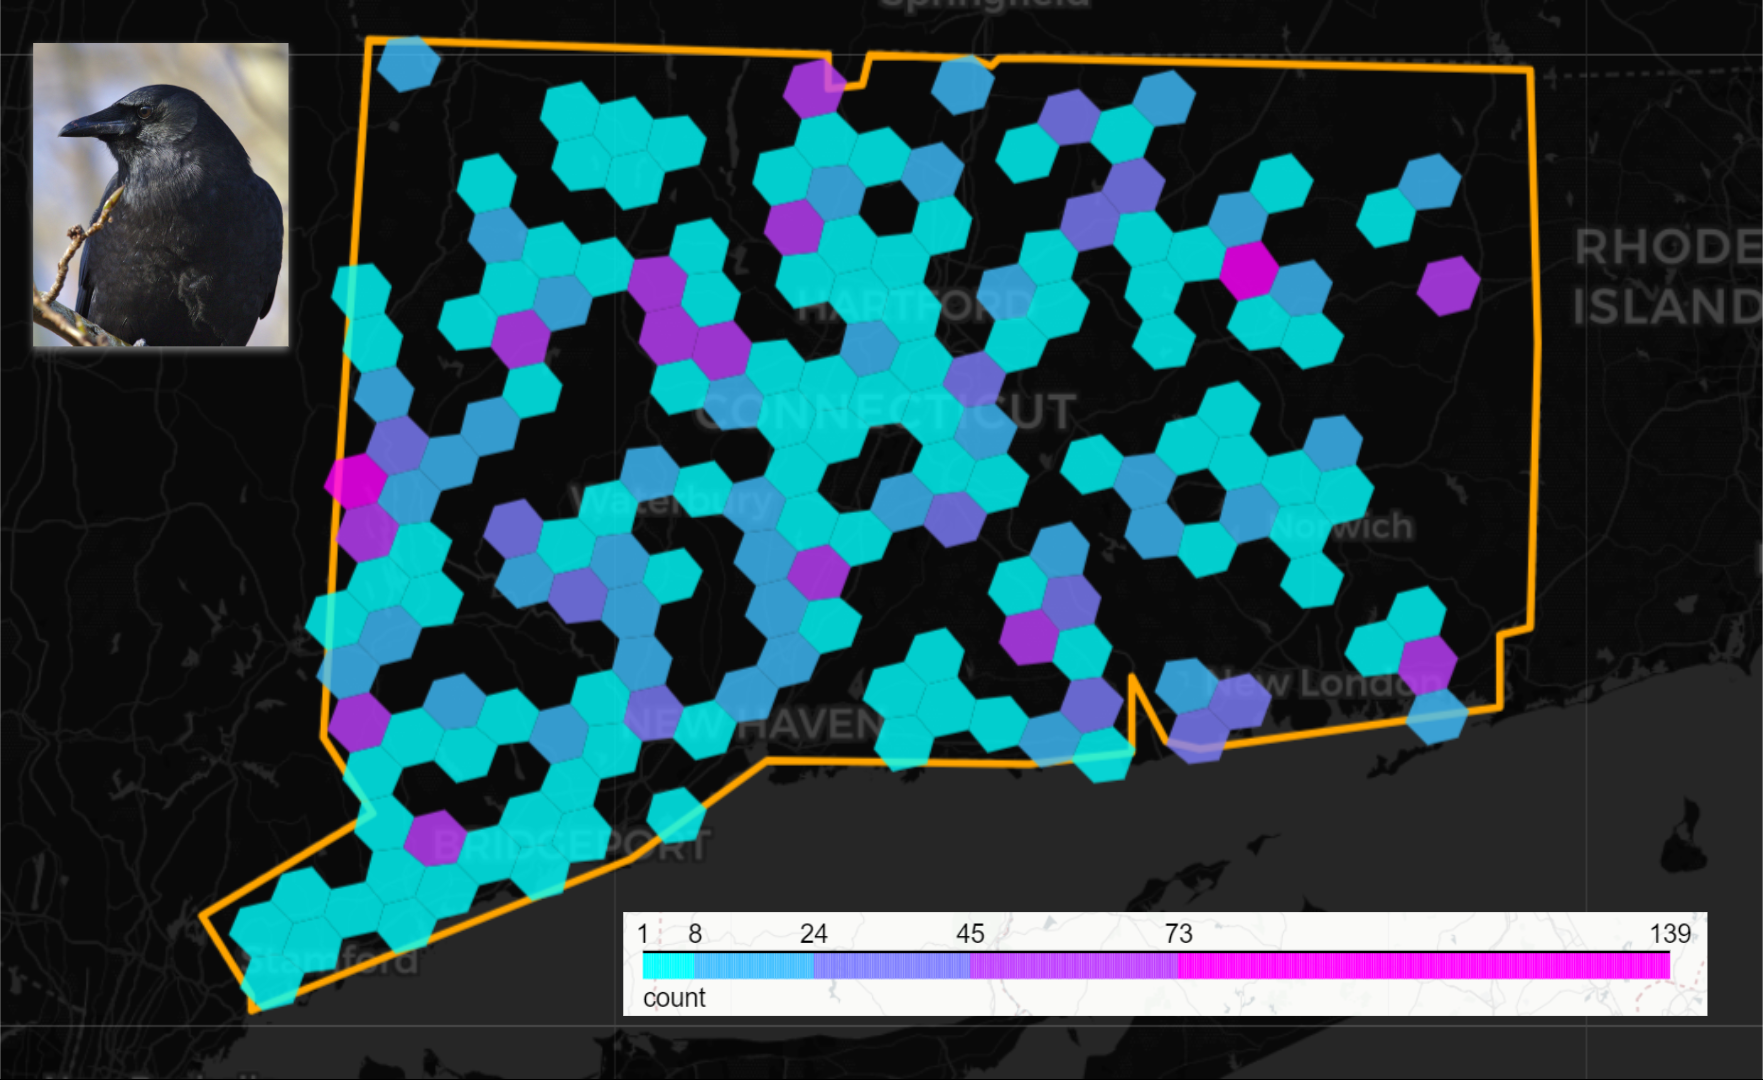
Method: This blog
Data source: Project FeederWatch, TheCornellLab
Tools: Python, geopandas, PyScript
Day 10: North America
Cities in the path of the total solar eclipse coming up on April 8, 2024, sized and colored by population. Click the image below to explore the map!
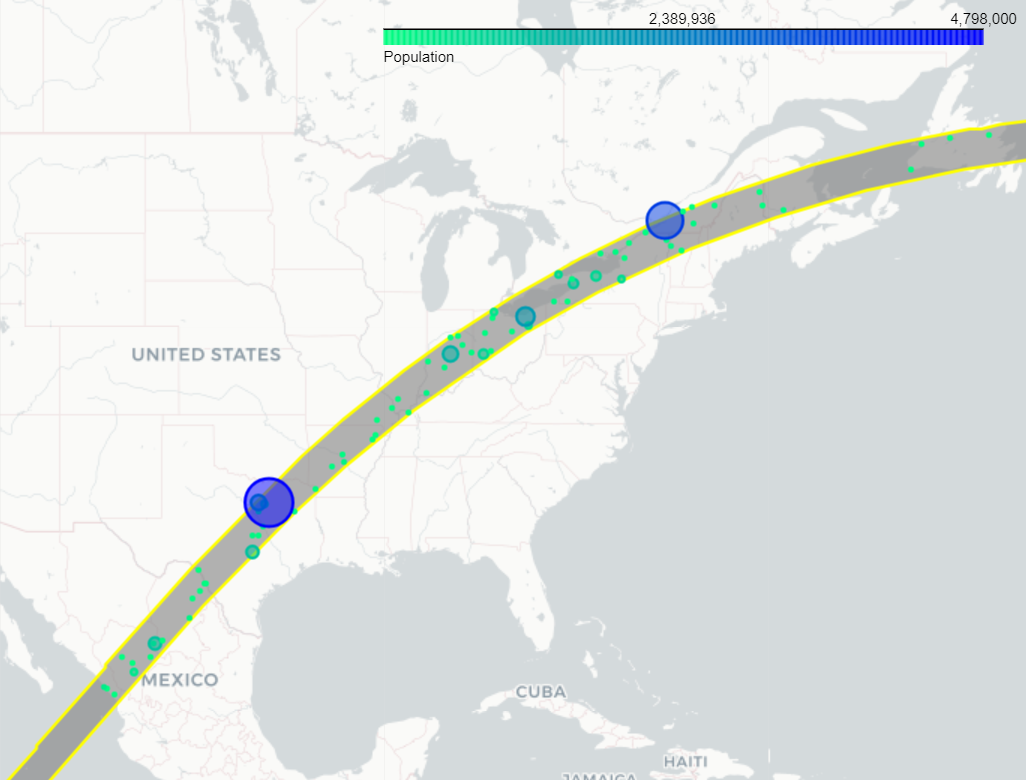
Data sources: Eclipses: NASA, Cities: Natural Earth
Tools: Python, geopandas, PyScript
Day 11: Retro
Went with a retro-futuristic 80s aesthetic. Groovy and hypnotic!
Data sources: Natural Earth
Tools: QGIS
Day 12: South America
Volcanoes of Ecuador
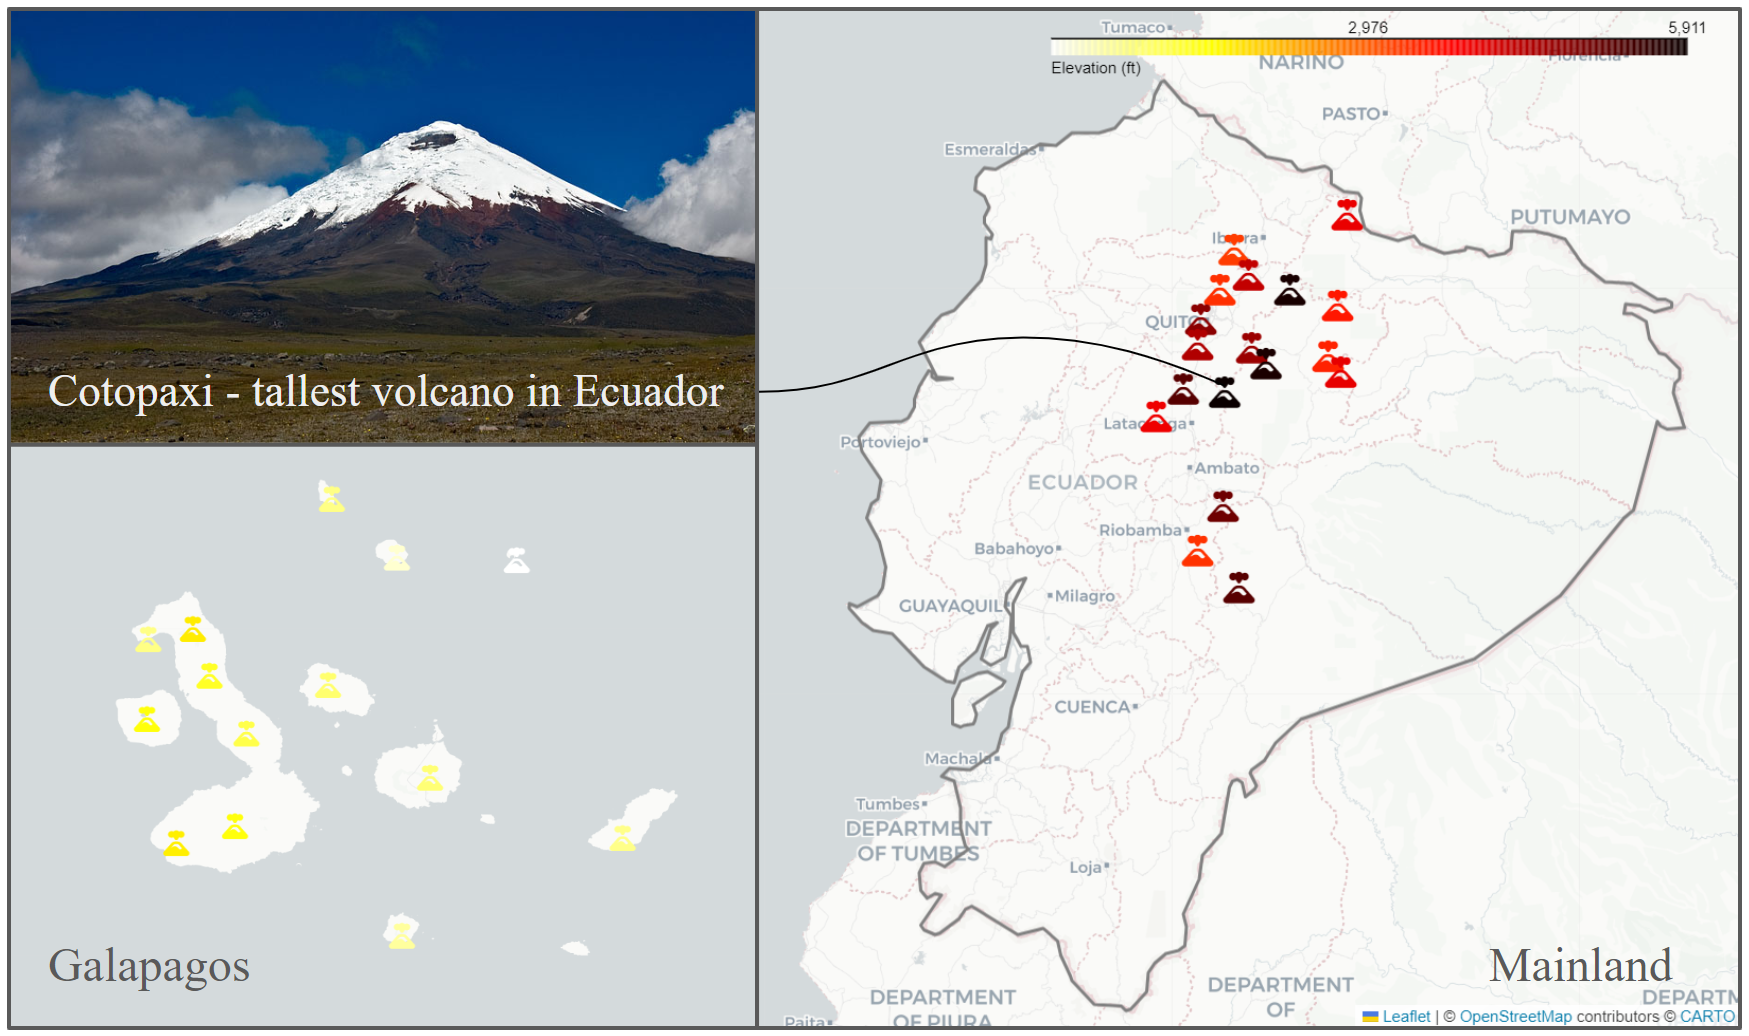
Data sources: Princeton
Tools: Python, geopandas, PyScript
Day 13: Choropleth
Privately-managed vs. publicly-managed trees in Seattle.
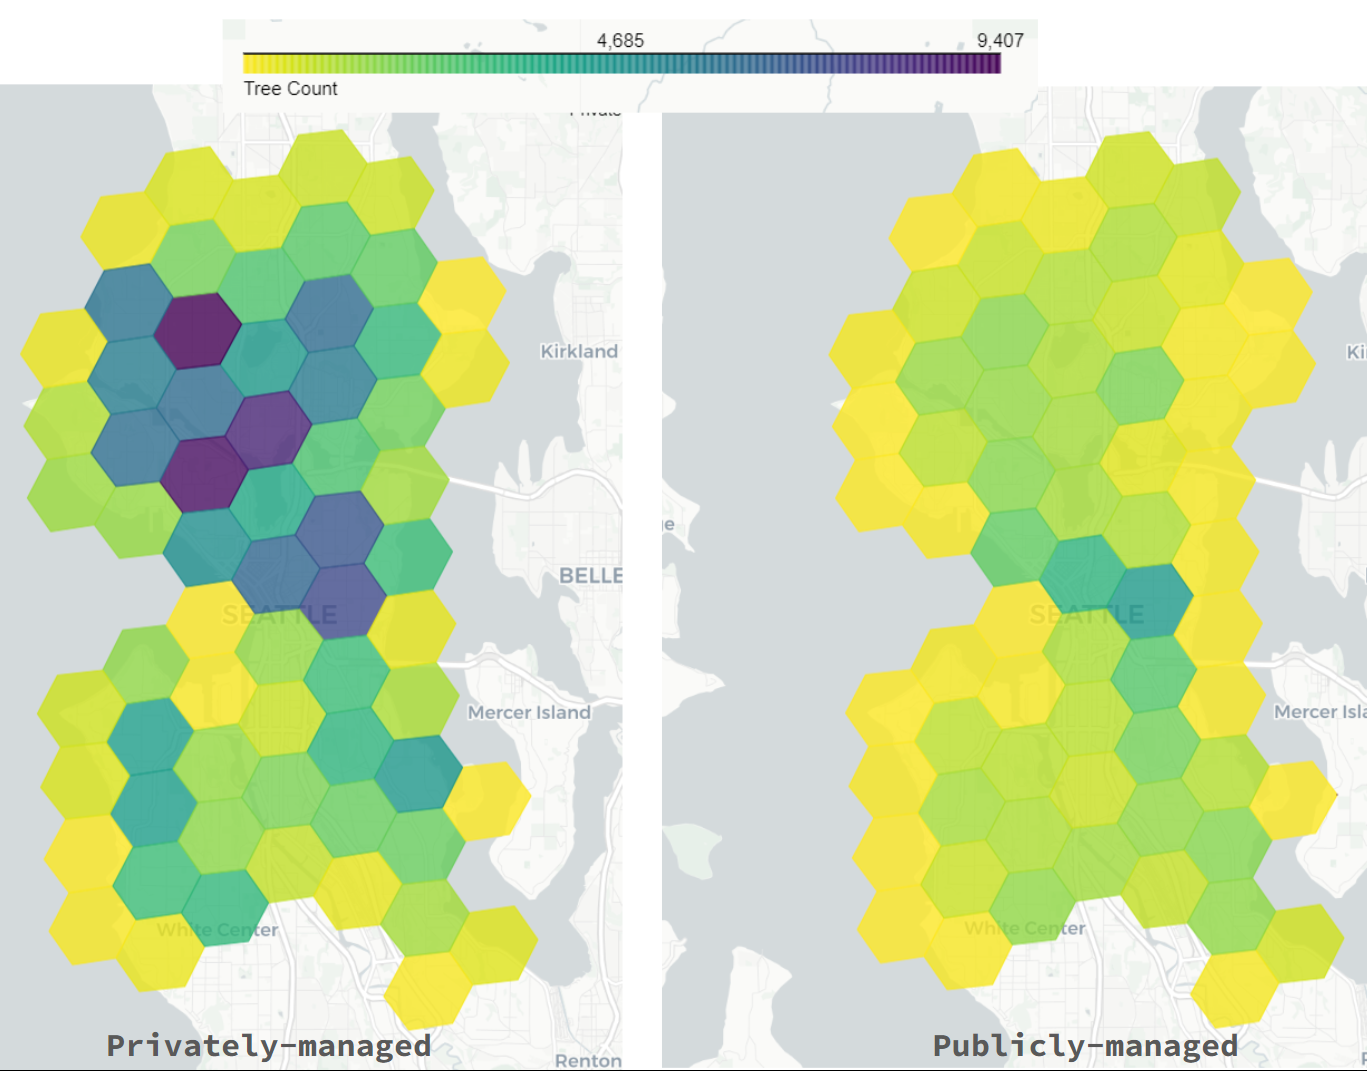
Data source: Trees from SDOT
Tools: Python, geopandas
Day 14: Europe
Railways in Spain and Portugal, rainbow colored for no reason.
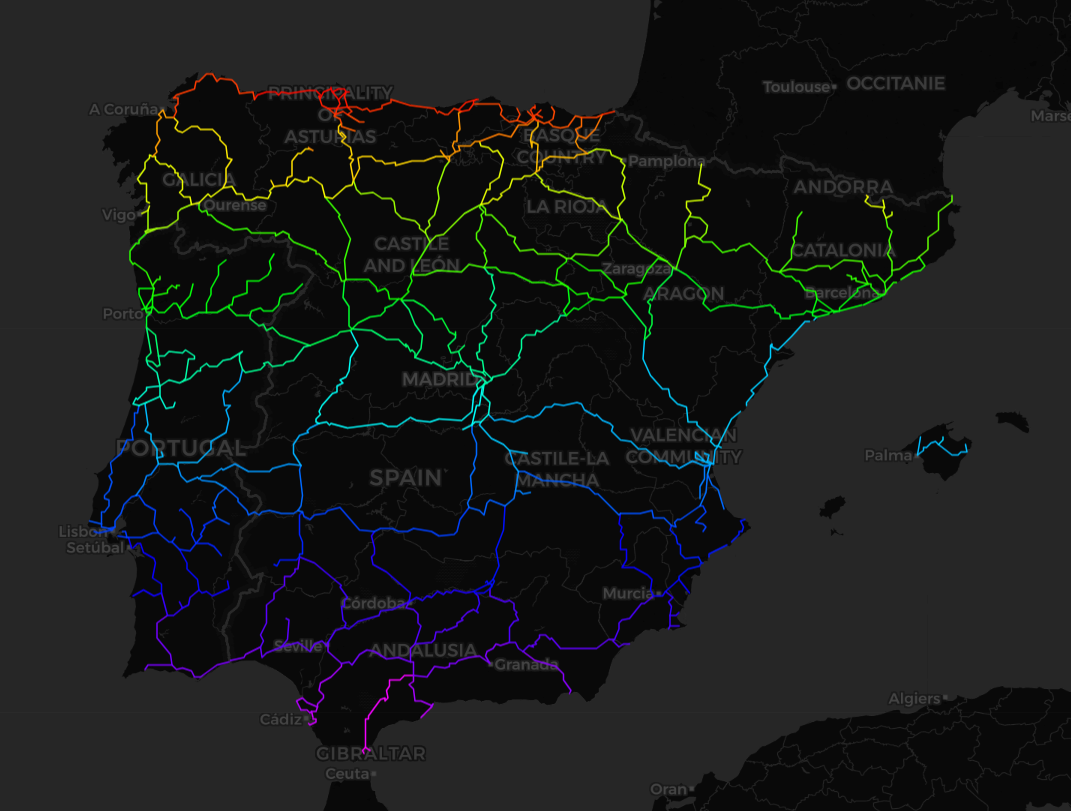
Data sources: Railways from Natural Earth
Tools: Python, geopandas, PyScript
Day 15: OpenStreetMap
Boat rentals and my Strava kayaking tracks. Still a spot I need to try!
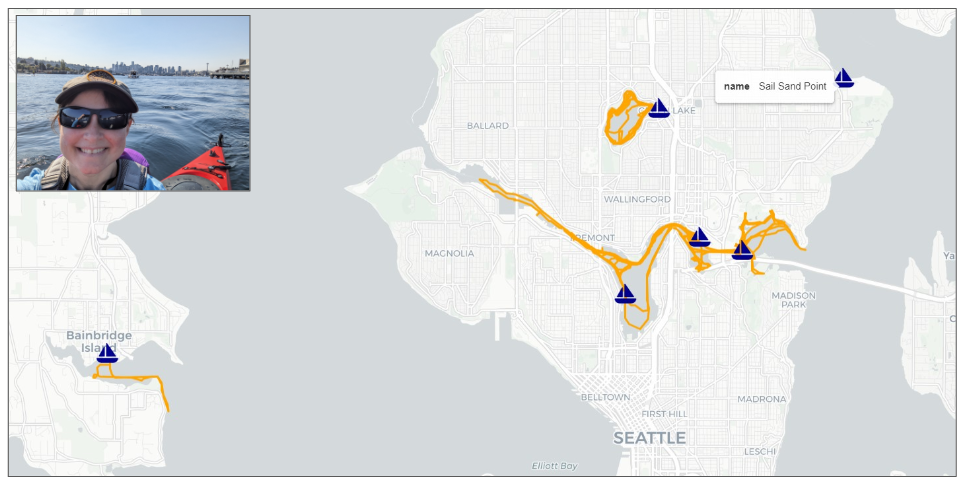
Data Source: Boat rentals from OpenStreetMap via overpass-turbo. Kayak tracks from Strava.
Tools: Python, geopandas
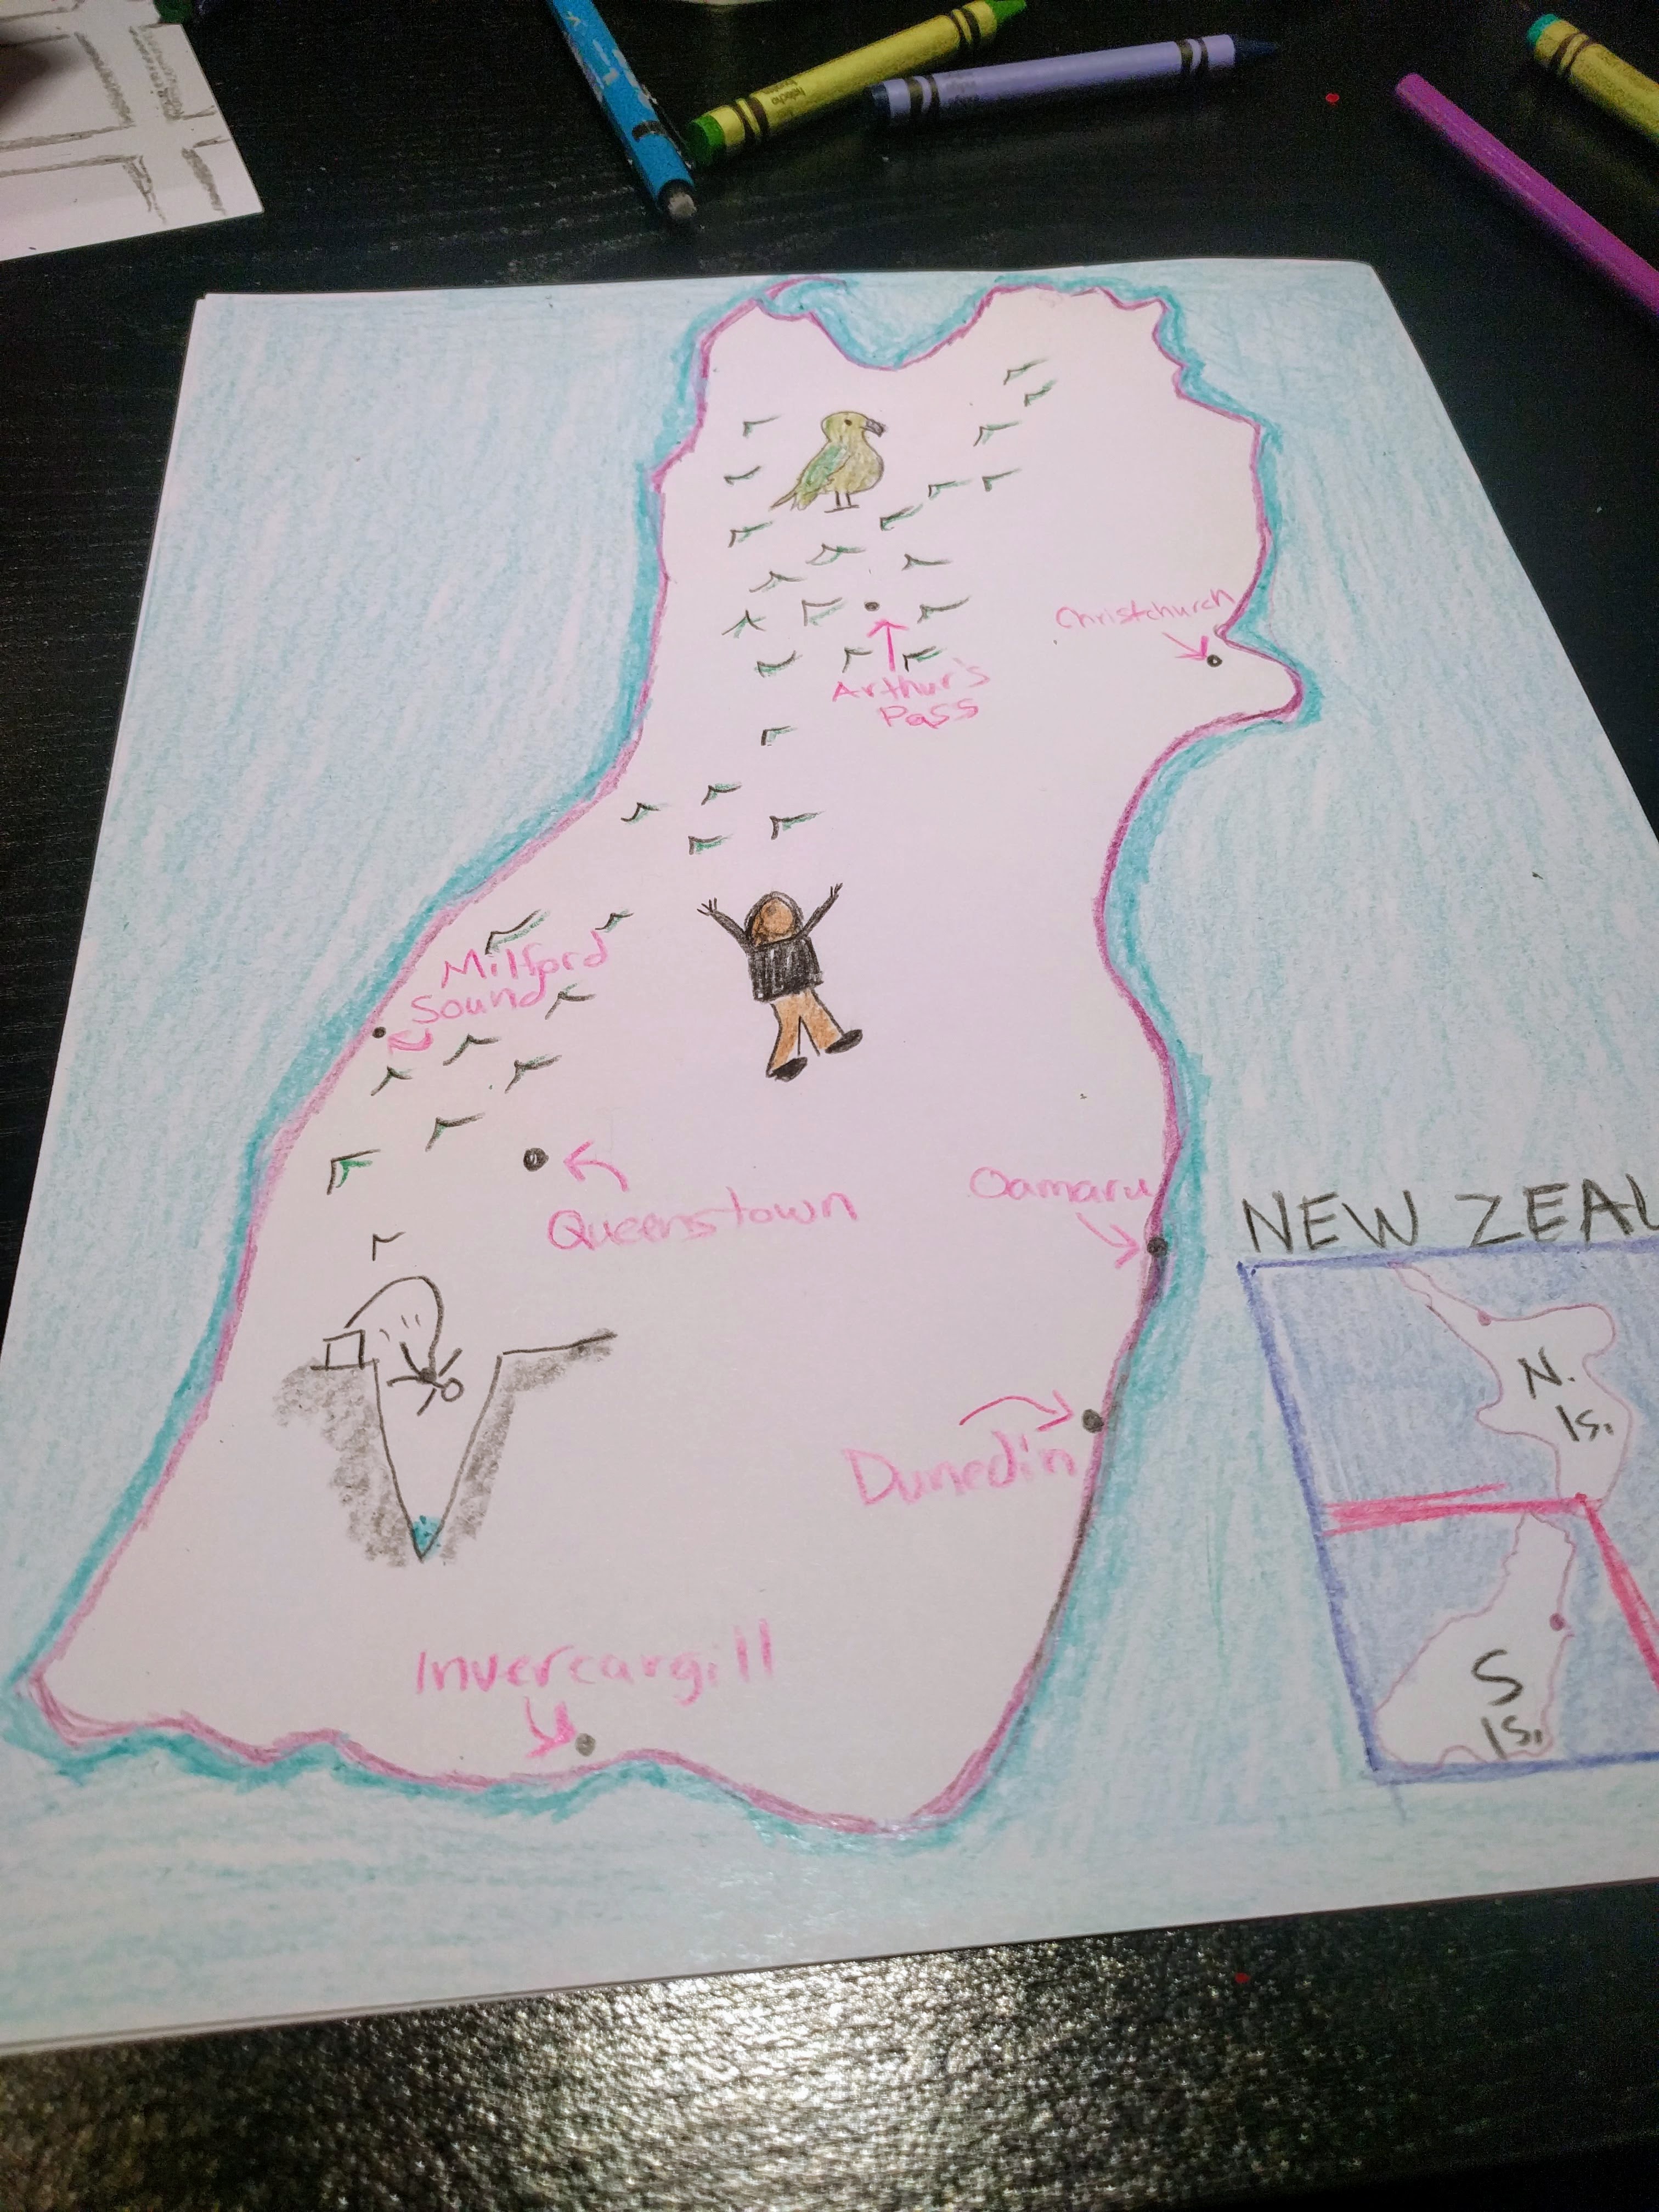
Day 16: Oceania
A hand-drawn map of my trip to New Zealand.
Day 17: Flow
Rufous hummingbirds on their way North up the West coast of the USA. Showing sightings on every Saturday from January-April, 2023.
Data source: Project FeederWatch, TheCornellLab
Tools: Python, geopandas
Day 18: Atmosphere
Seattle summers have been smoky in recent years. This year was bad in July and August.
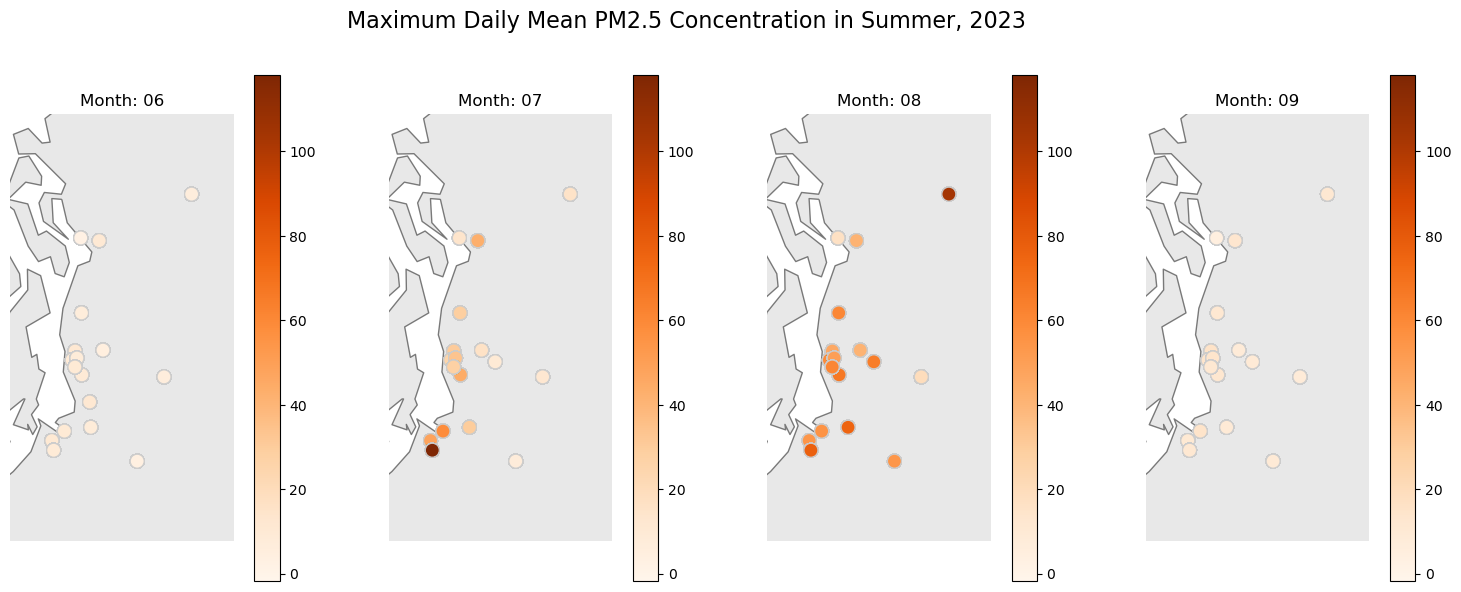
Data souce: EPA
Tools: Python, geopandas, matplotlib
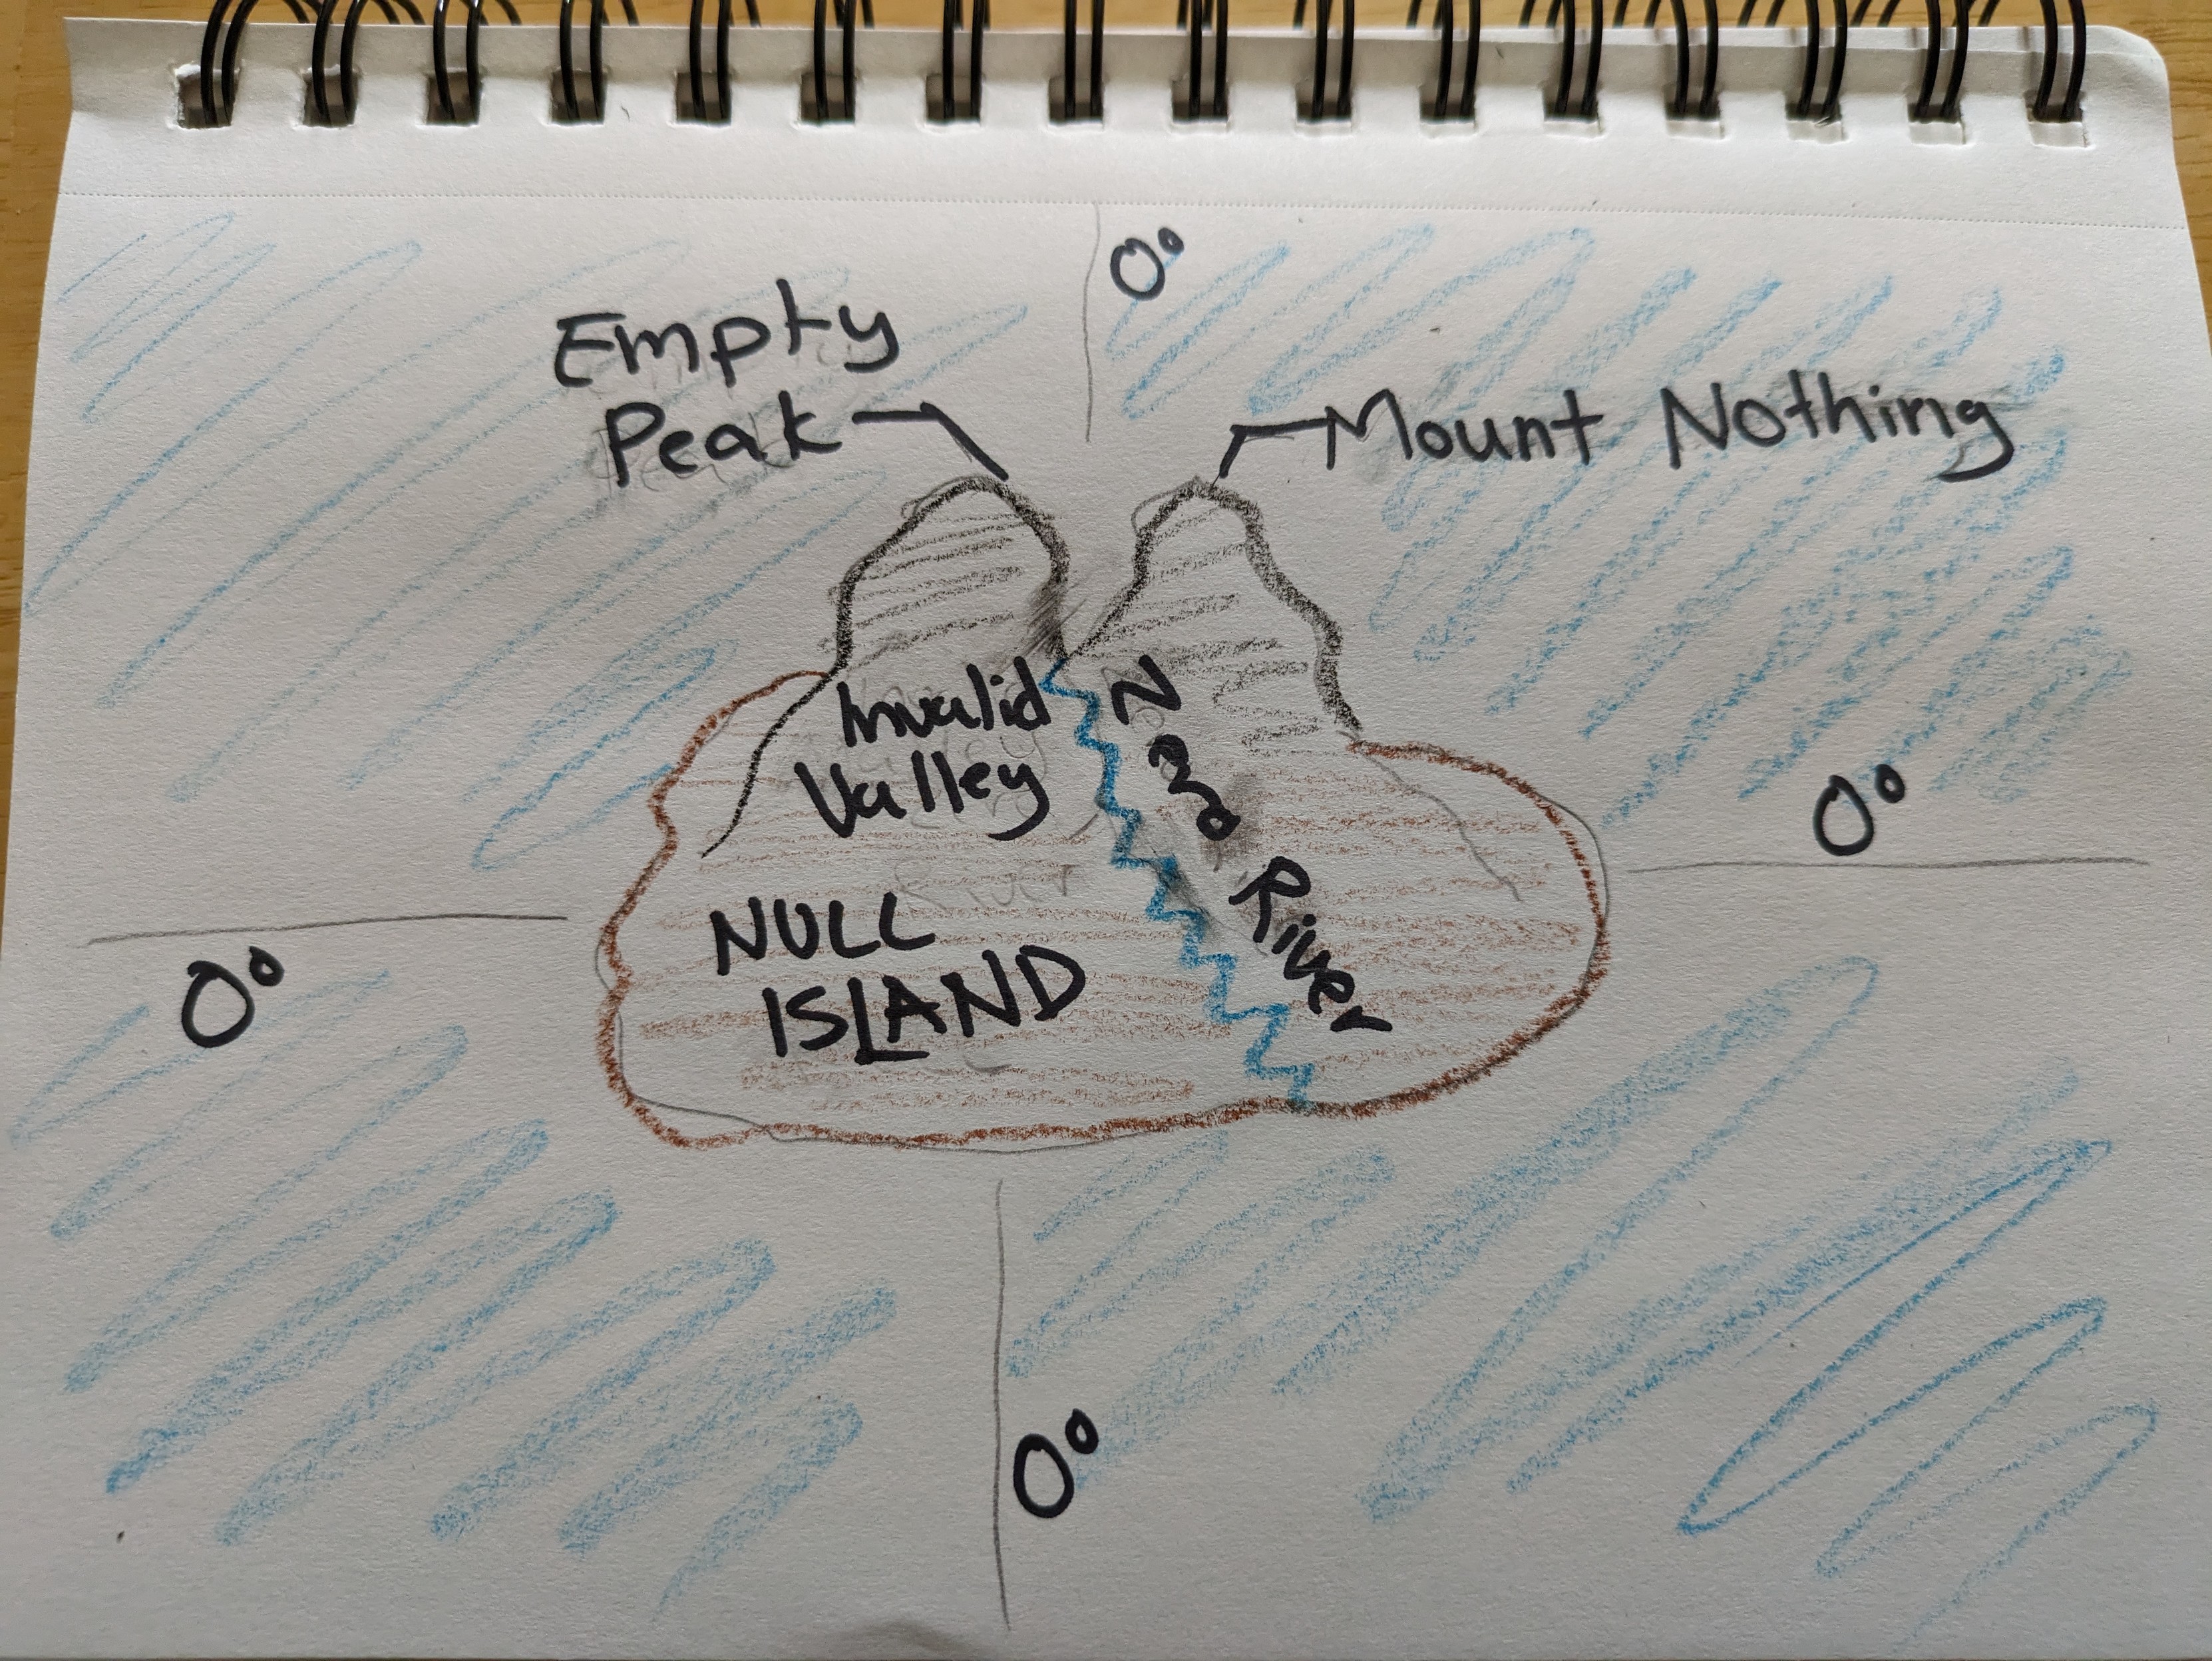
Day 19: 5-minute map
Null Island, featuring Empty Peak, Mount Nothing, Invalid Valley, and Zero River. I set a timer so I can safely say I spent 5 minutes on this. 😄
Day 20: Outdoors
Trailheads in Washington that are within 1 mile of a transit stop.
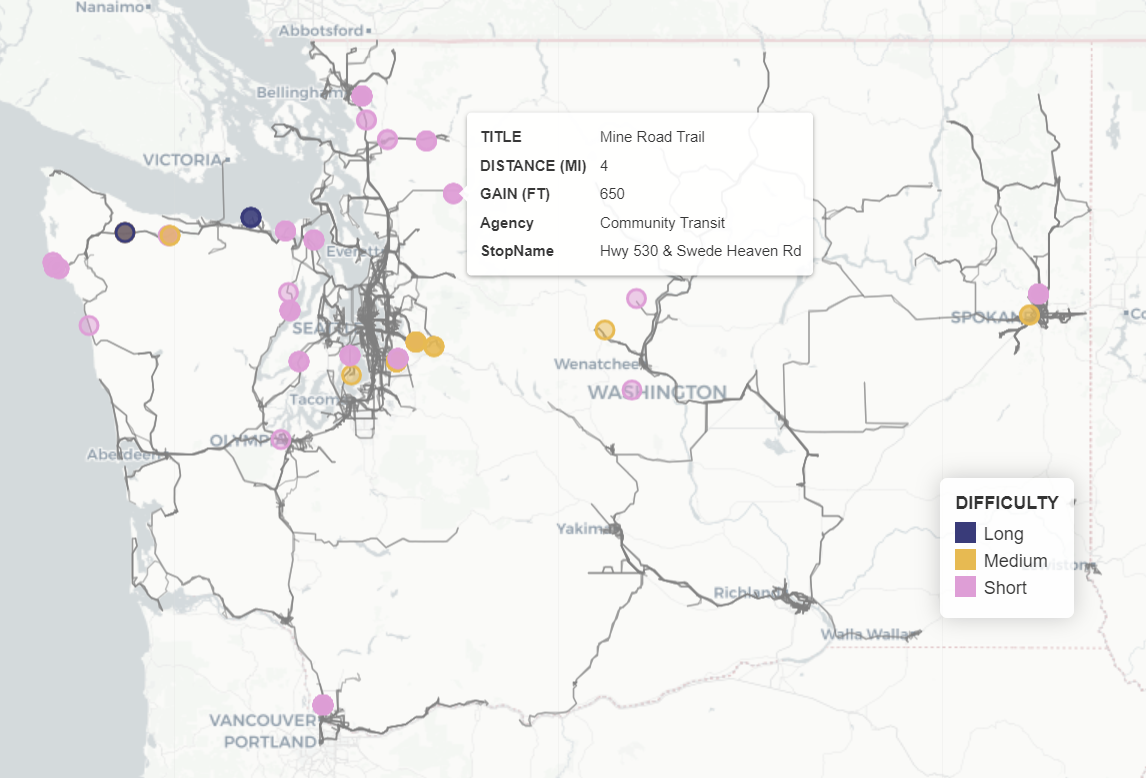
Data sources: Hikes: Washington Trails Association, Transit: WSDOT
Tools: Python, geopandas, PyScript
Day 21: Raster
Top rated hikes in Mount Rainer National Park with a randomly colored elevation raster background.
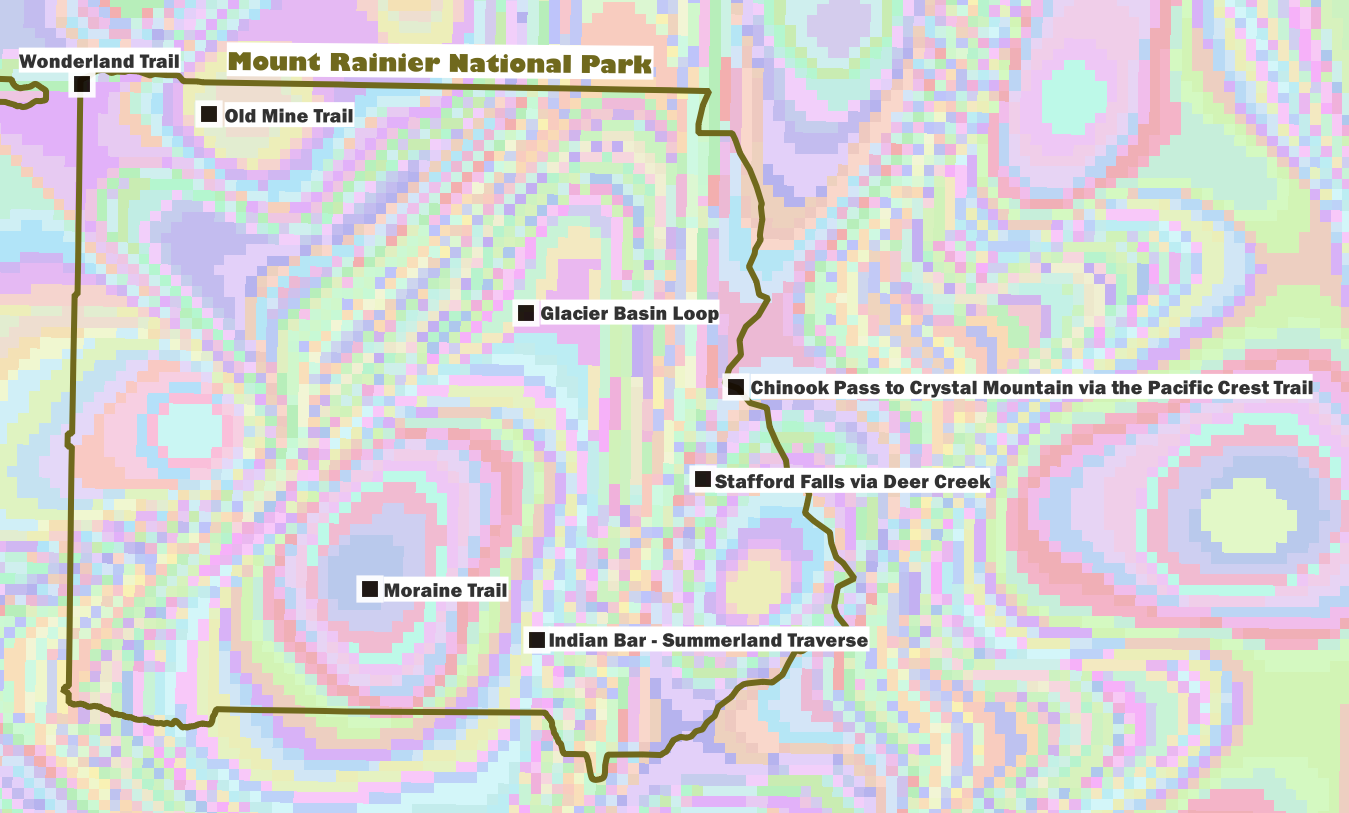
Data sources: Hikes: Washington Trails Association, National Park Boundary: NPS, Elevation: Natural Earth
Tools: QGIS
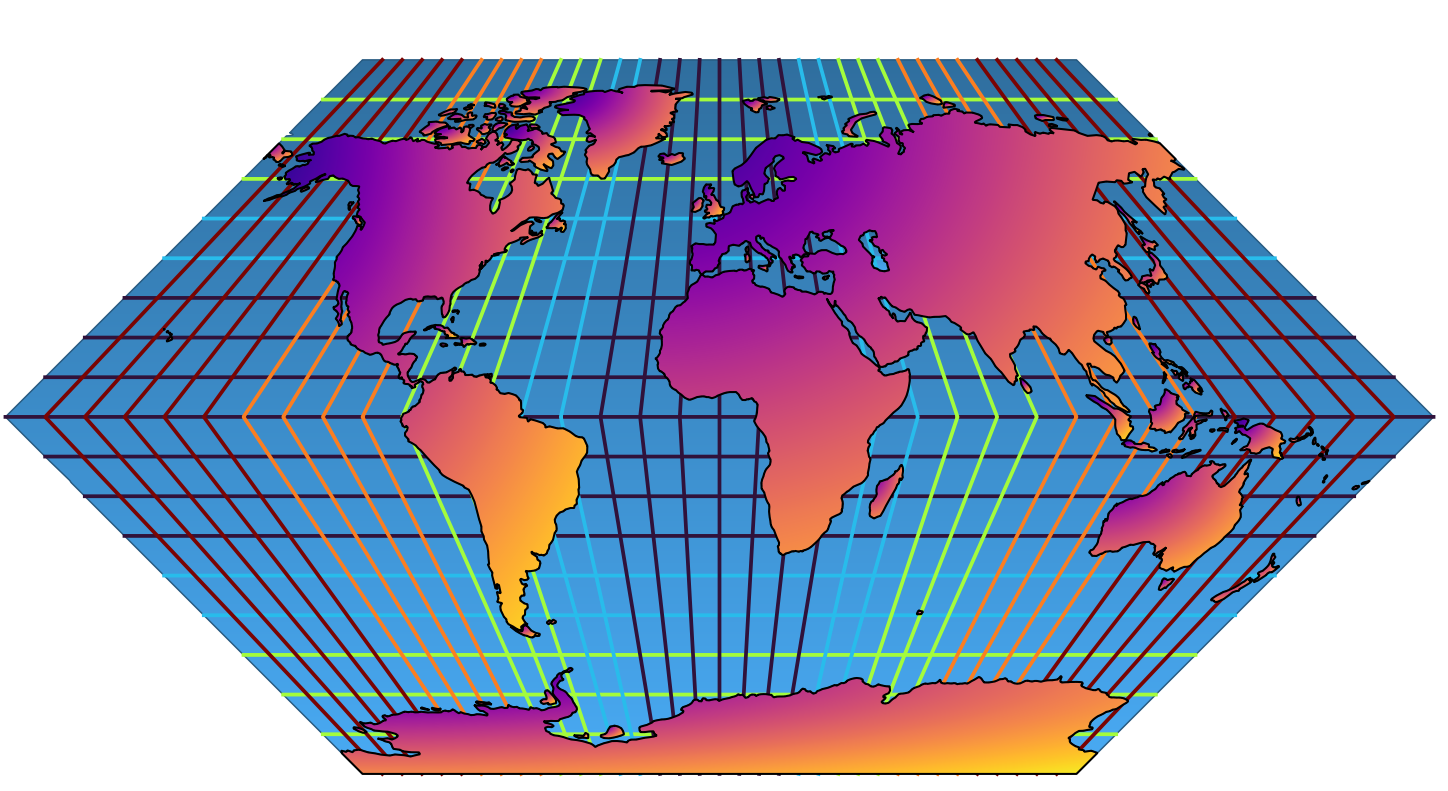
Day 22: North is not always up
World timezones starting at the North Pole. North is in the center.
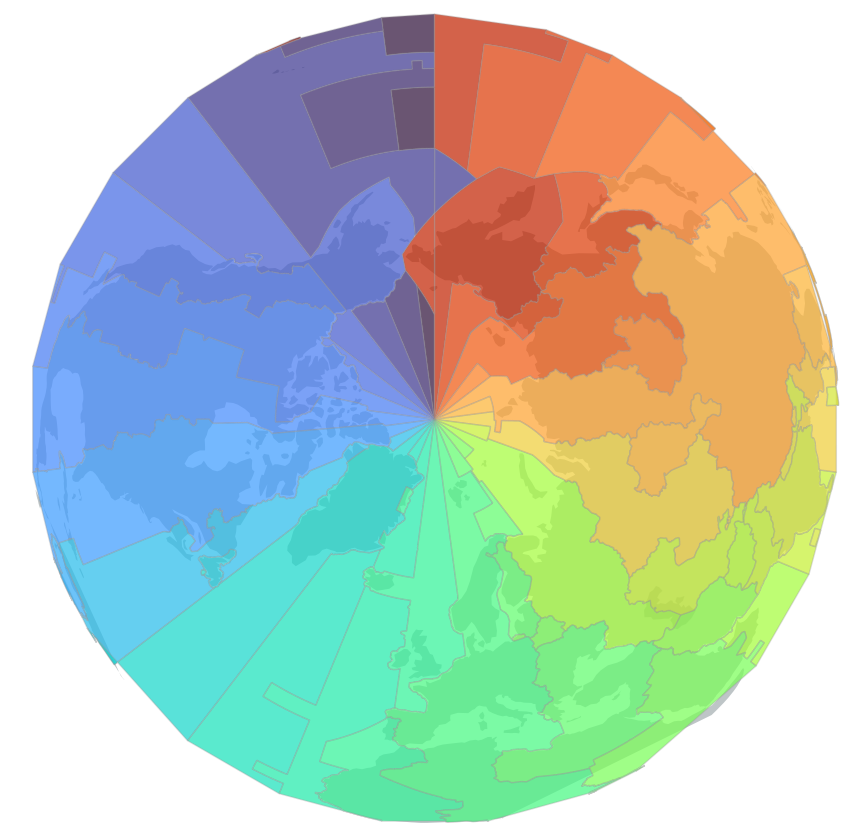
Data sources: Natural Earth
Tools: QGIS
Day 23: 3D
Not all trees in this dataset have heights, but these ones do. Actual tree heights multiplied by 30, colored by ownership.
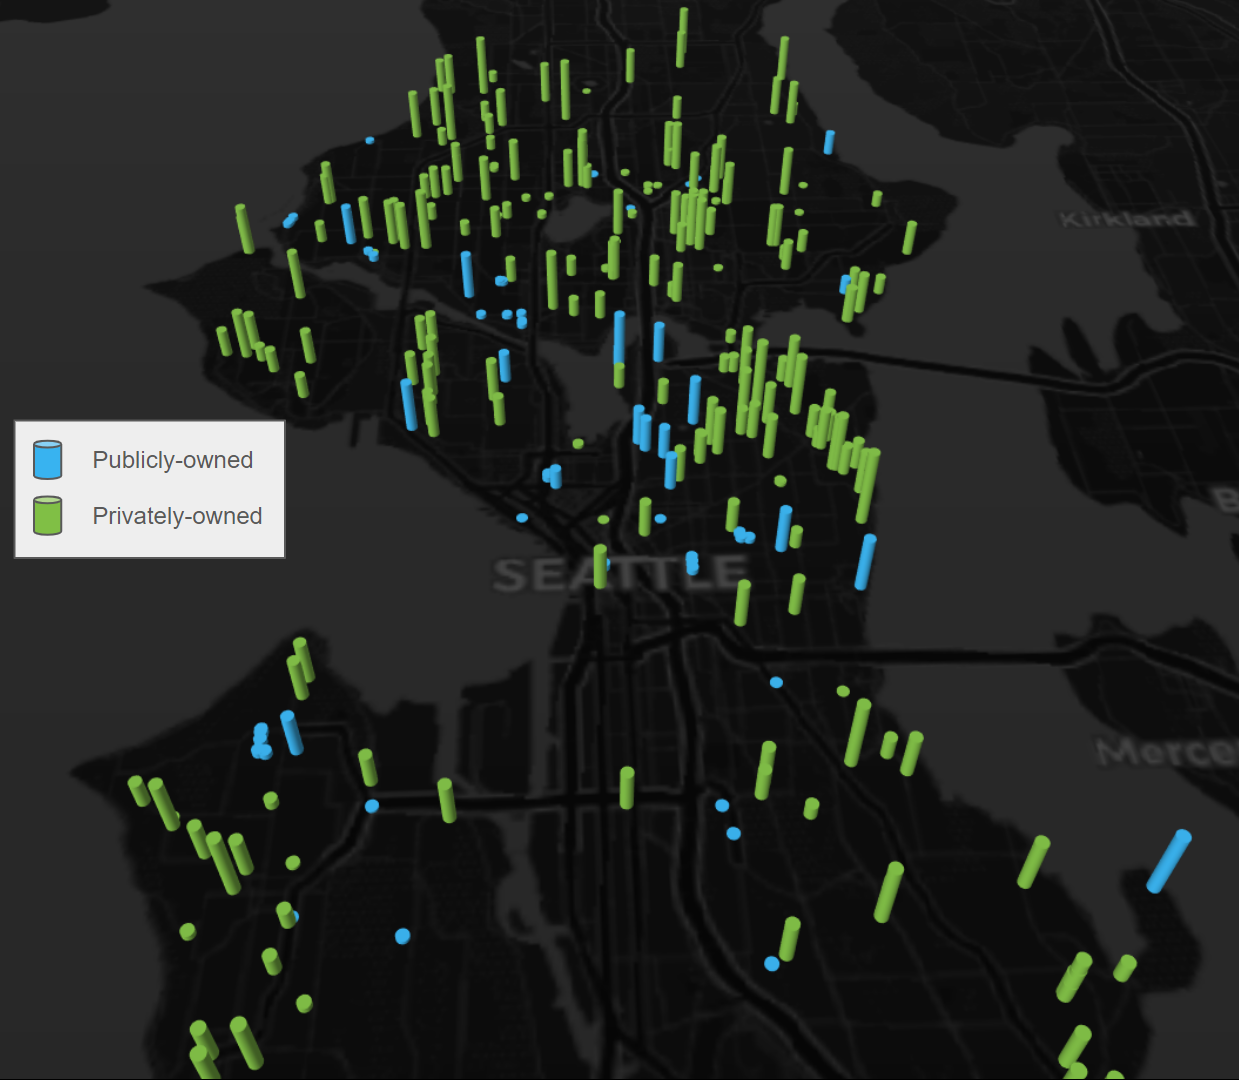
Data sources: Trees from SDOT
Tools: QGIS
Day 24: Black & white
More trees! Black Cottonwoods and Oregon White Oaks in Seattle.
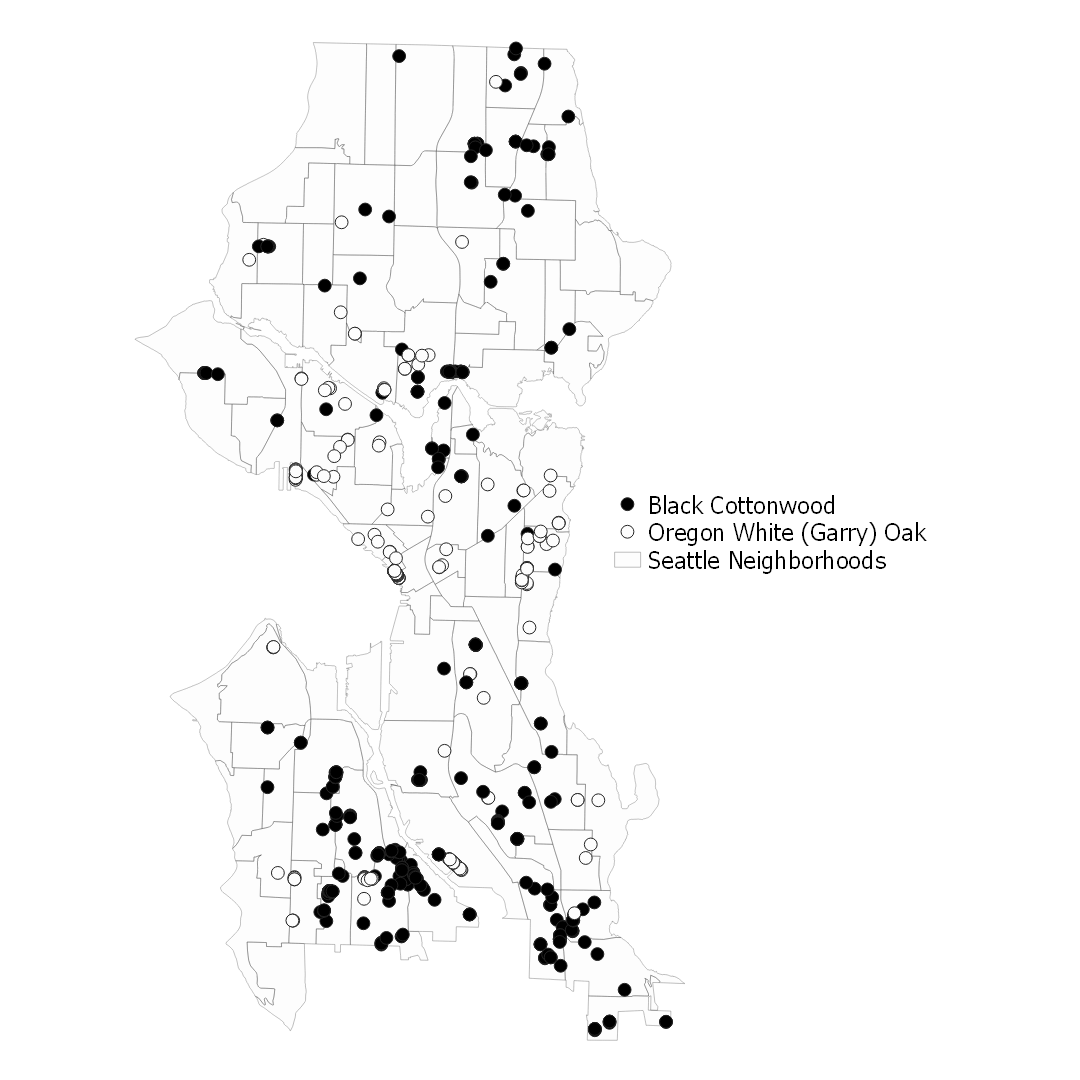
Data sources: Trees from SDOT, neighborhoods from City of Seattle
Tools: QGIS
Day 25: Antarctica
A map of Antarctica inspired by my Retro map’s theme.
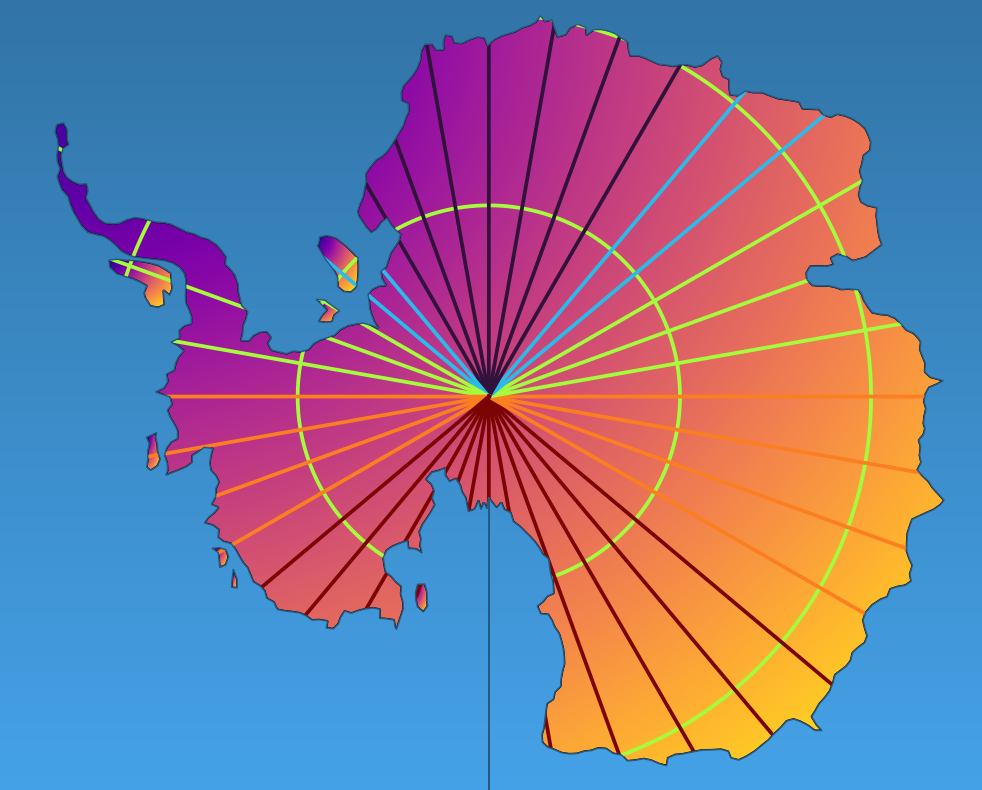
Data sources: Esri
Tools: QGIS
Day 26: Minimal
Transit lines in the Seattle area.
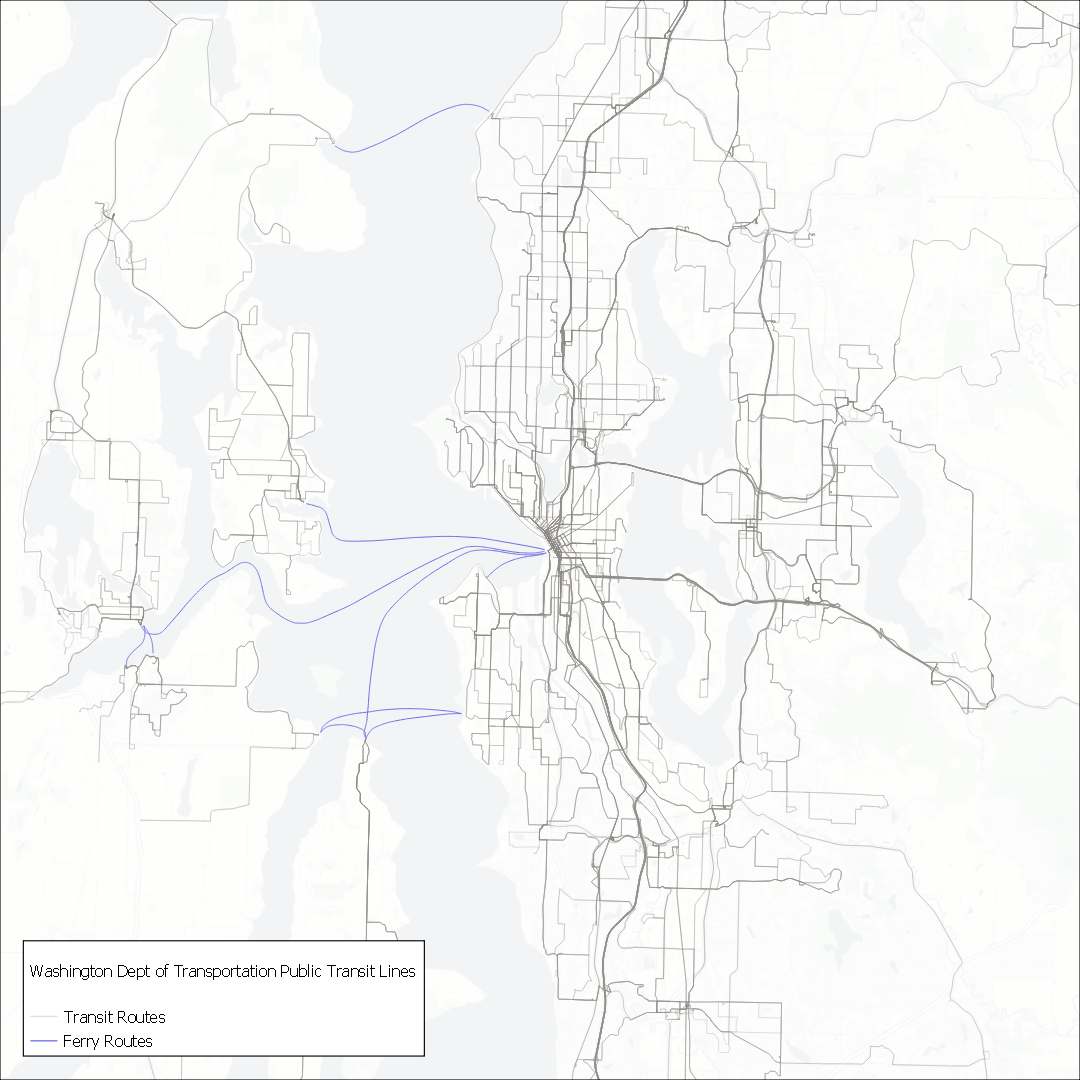
Data source: WSDOT transit lines, ferries
Tools: QGIS
Day 27: Dot
The three most common native trees in Seattle, according to SDOT’s tree database: Bigleaf Maple, Douglas Fir, and Western Red Cedar.
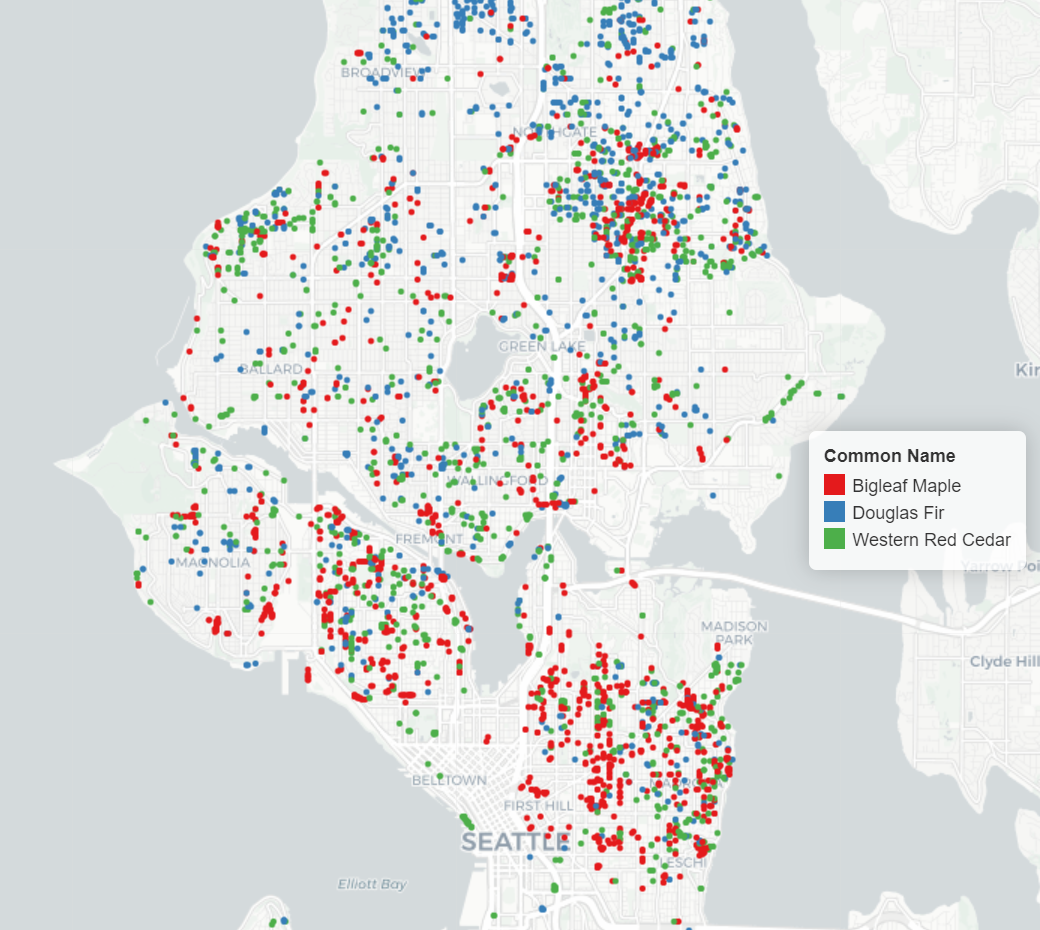
Data Source: Trees from SDOT
Tools: Python, geopandas, PyScript
Day 28: Is this a chart or a map?
Trees in a grid, colored by height.
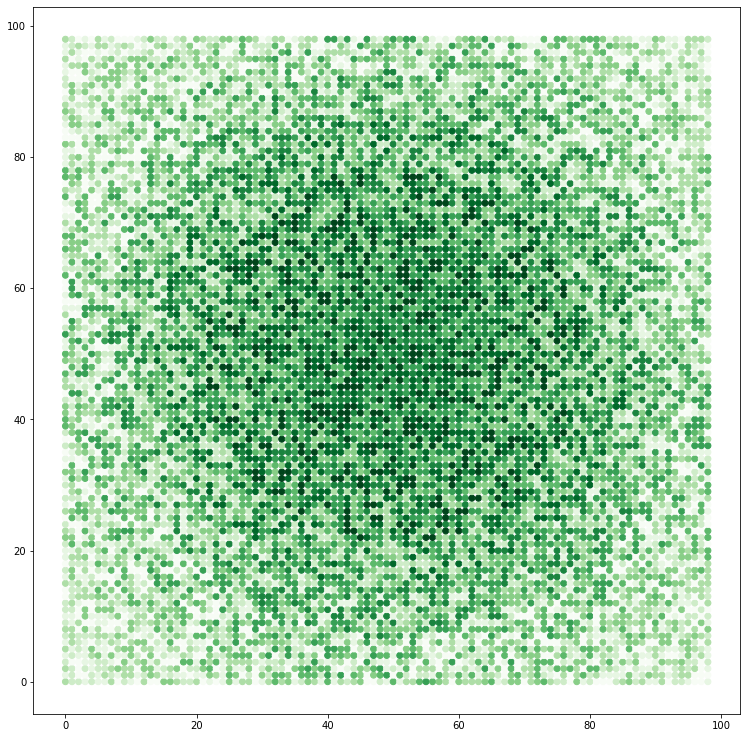
Data Source: Advent of Code
Tools: Python, geopandas
Day 29: Population
Urban areas in the Northern and Southern hemispheres.
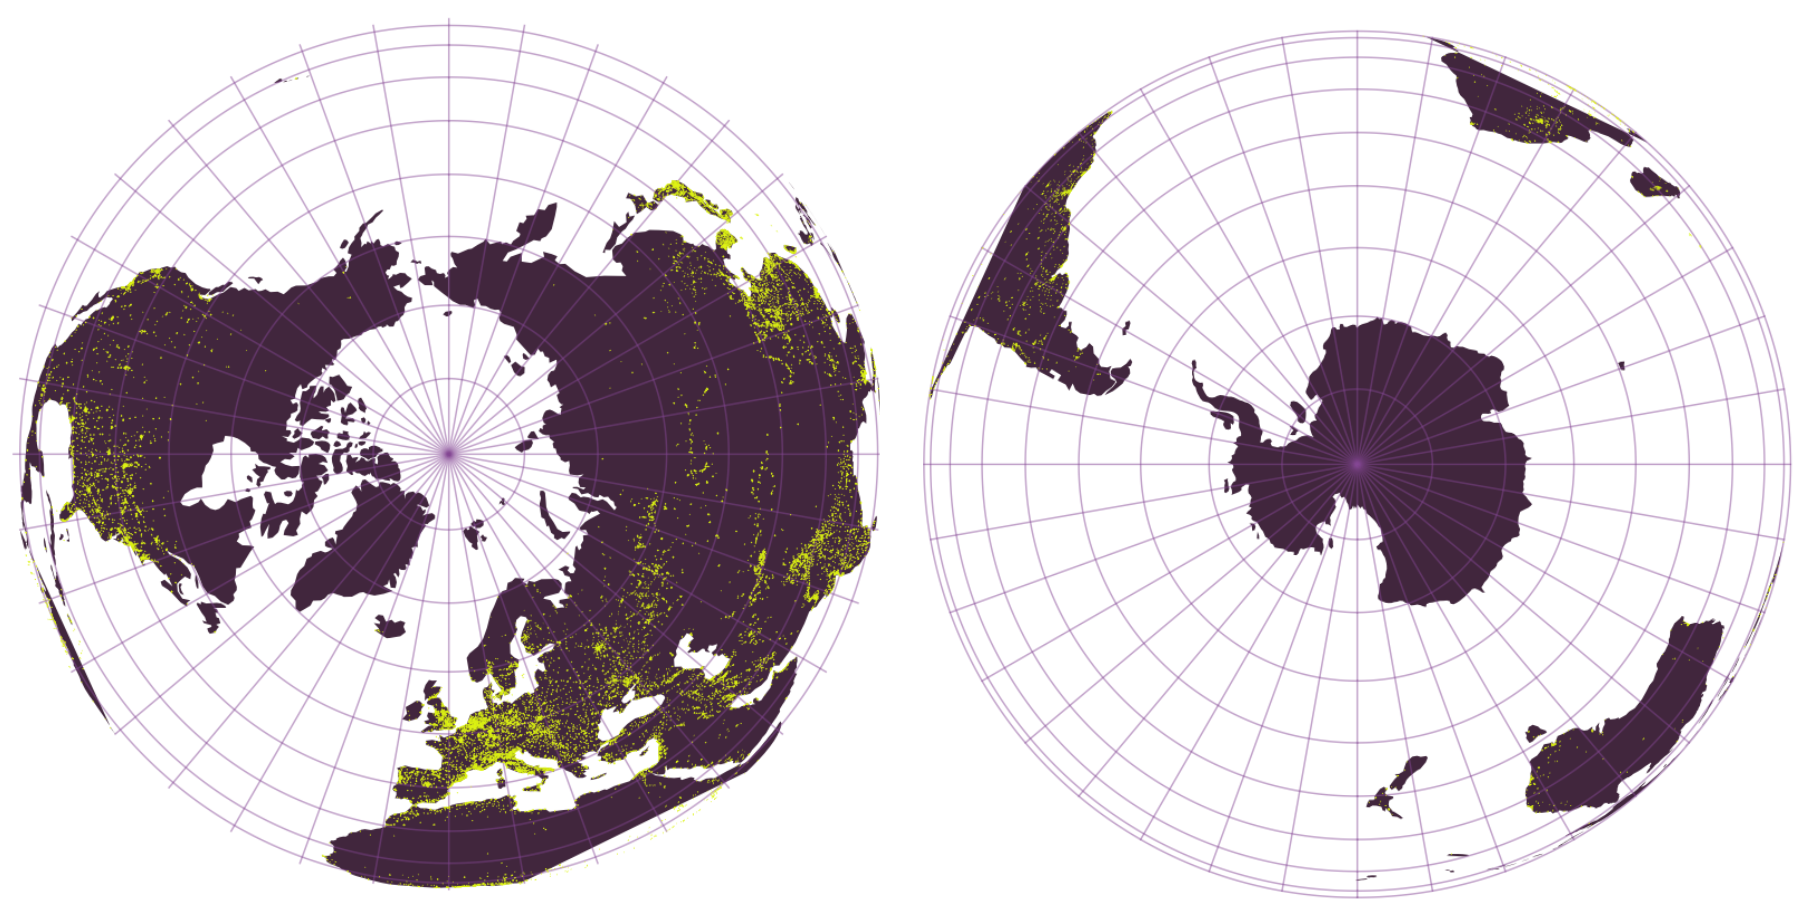
Data sources: Natural Earth
Tools: QGIS
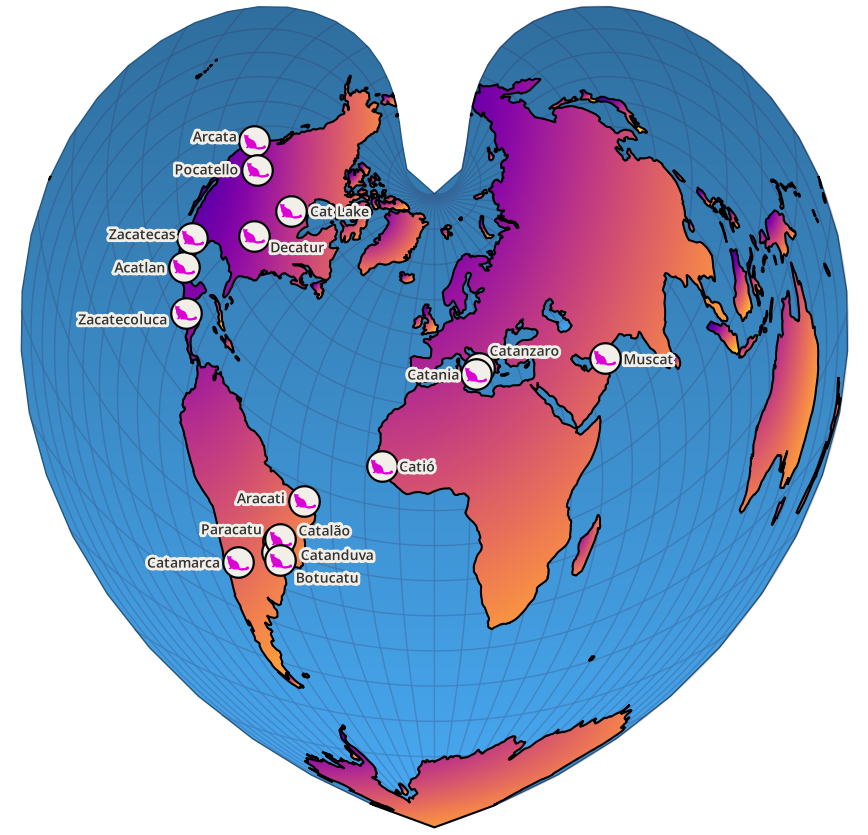
Day 30: “My favorite..”
Taking it full circle showing cities with “cat” in the name using a Bonne projection with a retro-future theme. Its heart-shaped representing my love for maps and cats!
Data sources: Natural Earth
Tools: QGIS